Recipes & Examples
Enable trace logging of HTTP requests/responses
If you want to debug one of your monitors, you can enable trace logging of HTTP requests and responses. This will log all the requests and responses made by Kuvasz to your monitors. All you need to do is to add the following configuration to your YAML configuration file:
- You can also use
DEBUG, but it won't log the request and response bodies, only the headers and status codes.
Home Assistant RESTful integration
Kuvasz can be easily integrated with Home Assistant using the RESTful integration by using its API. This allows you to create sensors for your most precious monitors and use them in your automations, scripts, or just to visualize the status of your monitors. You can even build your own custom dashboard with the data from your monitors!
Tip
If you have the authentication disabled, you can skip setting up your API key as a secret and you can also omit the X-API-KEY header in your requests.
Define your secret in Home Assistant
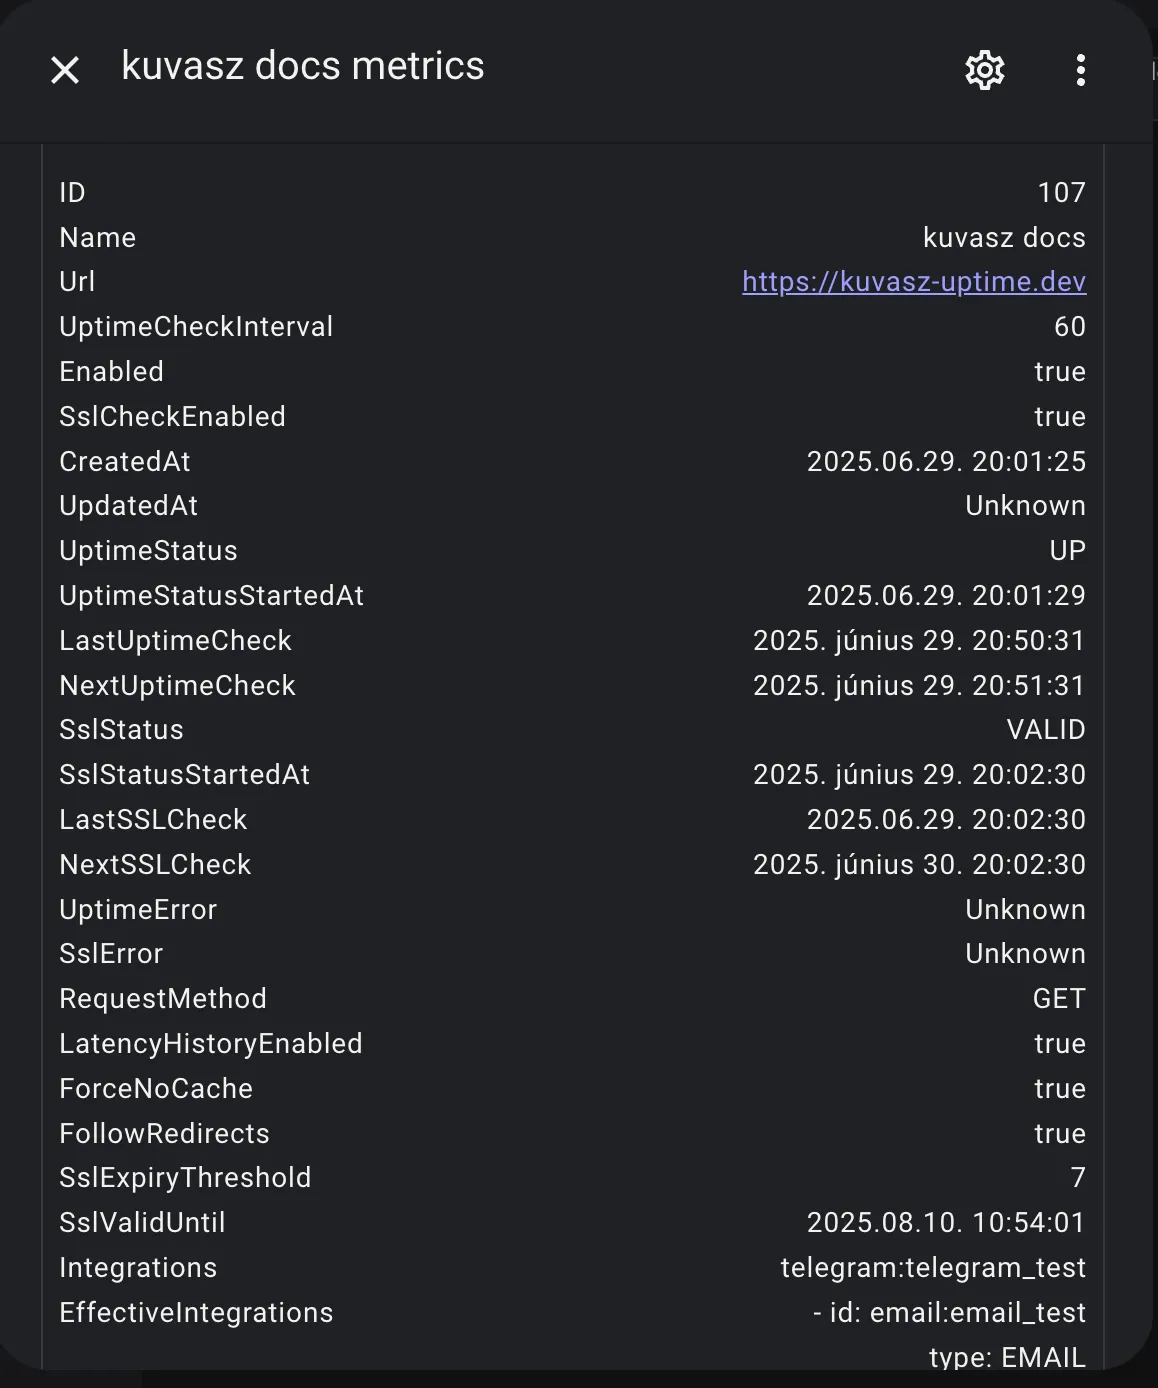
Sensor with JSON attributes
sensor:
  - name: "kuvasz docs metrics"
    unique_id: metrics_kuvasz_docs
    platform: rest
    verify_ssl: false
    scan_interval: 60
    resource: http://kuvasz.home/api/v1/monitors/107
    headers:
      X-API-KEY: !secret kuvasz_api_key
    value_template: "OK"
    json_attributes:
      - id
      - name
      - url
      - uptimeCheckInterval
      - enabled
      - sslCheckEnabled
      - createdAt
      - updatedAt
      - uptimeStatus
      - uptimeStatusStartedAt
      - lastUptimeCheck
      - nextUptimeCheck
      - sslStatus
      - sslStatusStartedAt
      - lastSSLCheck
      - nextSSLCheck
      - uptimeError
      - sslError
      - requestMethod
      - latencyHistoryEnabled
      - forceNoCache
      - followRedirects
      - sslExpiryThreshold
      - sslValidUntil
      - integrations
      - effectiveIntegrations
Result:
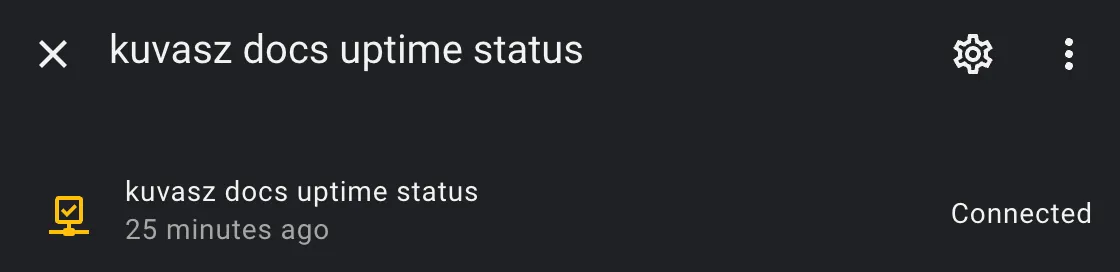
Binary sensor for uptime as connectivity
binary_sensor:
  - name: "kuvasz docs uptime status"
    unique_id: uptime_kuvasz_docs
    platform: rest
    verify_ssl: false
    scan_interval: 60
    resource: http://kuvasz.home/api/v1/monitors/107
    headers:
      X-API-KEY: !secret kuvasz_api_key
    device_class: connectivity
    value_template: >
      {% set status = value_json.uptimeStatus %}
      {{ status == 'UP' }}
    availability: >
      {{ value_json.uptimeStatus is not none }}
Result:
Full YAML example (app-config + monitors + integrations)
This is just a full example of a YAML configuration file, which you can use as a starting point for your own configuration. You can copy and paste it into your own configuration file, and then modify it to suit your needs, but always make sure that you read the corresponding documentation sections for each feature or integration you want to use.
Warning
Be aware that if you define your monitors via YAML, you cannot use the Web UI to modify them, you can only view them there!
micronaut.security.enabled: true
micronaut.security.token.generator.access-token.expiration: 86400 # 24 hours
admin-auth:
  username: YourSuperSecretUsername
  password: YourSuperSecretPassword
  api-key: ThisShouldBeVeryVerySecureToo
app-config:
  event-data-retention-days: 365 # 1 year
  latency-data-retention-days: 7 # 1 week
  log-event-handler: true
  language: en
---
smtp-config:
  host: 'your.smtp.server'
  port: 465
  transport-strategy: SMTP_TLS
  username: YourSMTPUsername
  password: YourSMTPPassword
---
integrations:
  pagerduty:
    - name: pd_global
      integration-key: YourOwnIntegrationKey
      global: true
      enabled: true
  slack:
    - name: slack_default
      webhook-url: 'https://hooks.slack.com/services/T00000000/B00000000/XXXXXXXXXXXXXXXX'
  email:
    - name: email_implicitly_enabled
      from-address: noreply@kuvasz-uptime.dev
      to-address: your@email.address
  telegram:
    - name: telegram_disabled
      api-token: 'YourToken'
      chat-id: '-1232642423121'
      enabled: false
---
monitors:
  - name: "full configuration example"
    url: "https://akobor.me"
    uptime-check-interval: 30
    enabled: true
    ssl-check-enabled: false
    request-method: "GET"
    latency-history-enabled: true
    follow-redirects: true
    force-no-cache: true
    ssl-expiry-threshold: 30
    integrations:
      - "telegram:telegram_disabled"
      - "slack:slack_default"
  - name: "minimal configuration example"
    url: "https://kuvasz-uptime.dev"
    uptime-check-interval: 5