Managing monitors
There are three ways to manage your monitors in Kuvasz: through the Web UI, using a YAML configuration file, or via the REST API. Each method has its own advantages, and you can choose the one that best fits your workflow.
Key concepts for all methods
- The name of the monitor must be unique, otherwise the creation/update will fail. If you want to update an existing monitor, you can use the same name, of course.
- The UI and the API will be in read-only mode if you have defined your monitors via YAML
Management methods
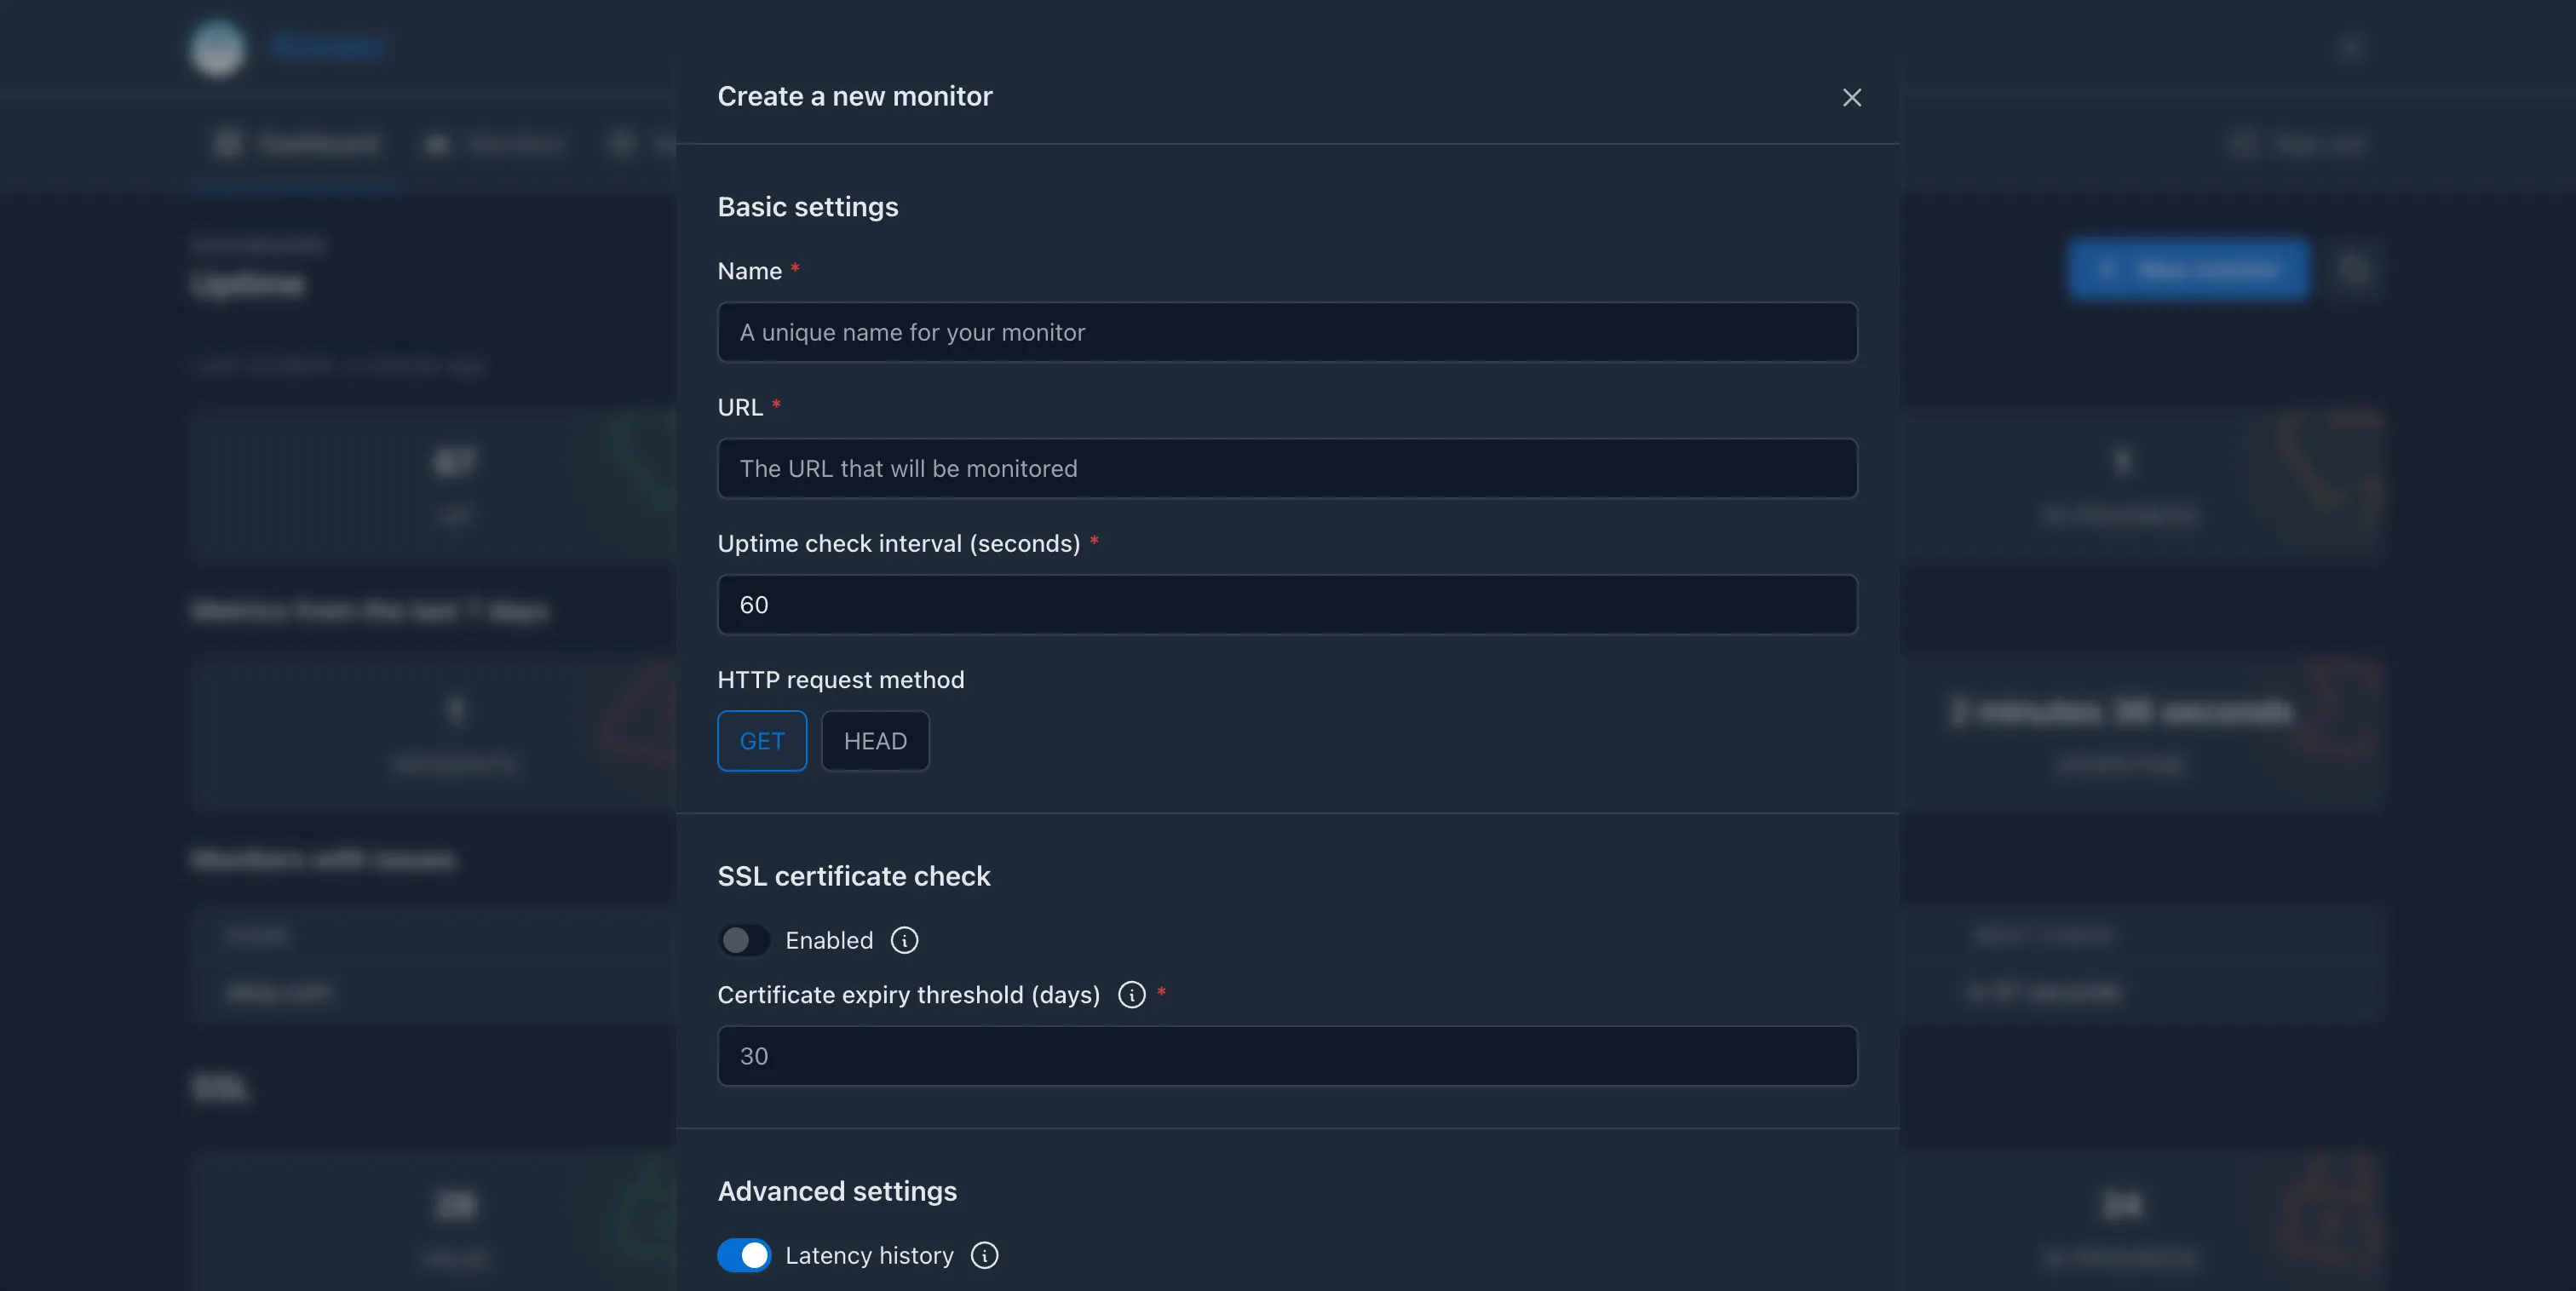
The Web UI should be intuitive and user-friendly enough to make it straightforward to create, edit, and manage your monitors. You can access the UI by navigating to the root of your Kuvasz instance (e.g. http://0.0.0.0:8080 if you're running it with the default port setup).
Consequences of describing your monitors as YAML
Be aware that if you define your monitors via YAML, you cannot use the UI, or the API to modify them, you can only view them there (read-only operations are permitted)!
In this case Kuvasz reads your YAML file on startup, compares the monitors in there with the existing ones in the database, and uses the YAML file as the source of truth.
The same applies if you used the UI or the API before to manage your monitors, and you decide to switch to YAML: unless your YAML definition matches the existing monitors by their name, existing monitors could be deleted or modified.
What happens if you add one or more monitor to your YAML file?
- If there is a monitor in the database that is not in the YAML file, it will be deleted.
- If there is a monitor in the YAML file that is not in the database, it will be created and added to the database.
- If there is a monitor in both the YAML file and the database, and they have the same name, the monitor in the database will be updated with the values from the YAML file.
What happens if you remove all of your monitors from the YAML file?
All monitors in the database will be kept (i.e. the ones that were created before via YAML). This is especially useful if you want to restore your monitors from your exported YAML backup, but you want to manage them on the UI in the future.
Vice versa: Another typical use case is when you want to manage your monitors via YAML, but you want to set them up initially via the UI or the API. In this case, you can export all your monitors to a YAML file, and then copy the content of that file into your own configuration file.
Changing a monitor's name
If you change the name of an existing monitor in the YAML file, it will be treated as a new monitor, and the old one will be deleted. This also means that all of your previously recorded events and metrics (i.e. latency history, uptime checks, etc.) will be lost for that monitor.
monitors:
- name: "My Monitor" # (1)!
  url: "https://kuvasz-uptime.dev" # (2)!
  uptime-check-interval: 60 # (3)!
  enabled: true # (4)!
  ssl-check-enabled: false # (5)!
  latency-history-enabled: true # (6)!
  request-method: "GET" # (7)!
  follow-redirects: true # (8)!
  force-no-cache: true # (9)!
  ssl-expiry-threshold: 30 # (10)!
  integrations: # (11)!
    - "email:my-email-integration"
# ... other monitors
- Name: The name of the monitor, which must be unique.
- URL: The URL of the monitor, which is the endpoint that will be monitored.
- Uptime check interval: The interval in seconds at which the uptime checks will be performed. The minimum value is 5 seconds.
- Enabled: Whether the monitor is enabled or not. If it's disabled, it won't be checked, and no events will be recorded for it.
- SSL check enabled: Whether the SSL check is enabled or not. If it's disabled, the monitor won't check the SSL certificate.
- Latency history enabled: Whether the latency history is enabled or not. If it's disabled, the monitor won't record latency history.
- Request method: The HTTP method to use for the uptime checks (e.g. GET, HEAD, etc.). Defaults to GET.
- Follow redirects: Whether the monitor should follow redirects or not. Defaults to true.
- Force no cache: Whether the monitor should send a
Cache-Control: no-cacheheader with the request. Defaults to true. - SSL expiry threshold: The number of days before the SSL certificate expires that the monitor should alert about it. Defaults to 30 days.
- Integrations: A list of integrations to assign to the monitor. The format is
"{integration-type}:{integration-name}", whereintegration-typeis the type of the integration (e.g.email,slack, etc.), andintegration-nameis the name of the integration as defined in theintegrationssection of your YAML file. Example:email:my-email-integration.
This section won't go into details about the API or about exact API calls, since it's well documented and must be self-explanatory. You can find more information about the available endpoints and their usage in the API documentation.
However, here are few of the most important endpoints:
GET /api/v1/monitors– List all monitorsGET /api/v1/monitors/{id}– Get a specific monitor by its IDPOST /api/v1/monitors– Create a new monitorPATCH /api/v1/monitors/{id}– Update an existing monitorDELETE /api/v1/monitors/{id}– Delete a monitor
Available settings
Name
The name of the monitor, which must be unique across all monitors.
URL
The URL of the monitor, which is the endpoint that will be monitored. It can be an HTTP or HTTPS URL.
Uptime check interval
The interval in seconds at which the uptime checks will be performed. The minimum value is 5 seconds.
Enabled
Whether the monitor is enabled or not. If it's disabled, it won't be checked, and no events will be recorded for it. Also disables SSL checks, because it toggles the whole monitor.
SSL check enabled
Whether the SSL check is enabled or not. If it's disabled, the monitor won't check the SSL certificate. This setting is probably only relevant for HTTPS URLs.
SSL expiry threshold
2.0.0
30
number
The number of days before the SSL certificate expires that the monitor should alert about it. Minimum value is 0, which mean that the monitor will alert you only on the day of the expiry.
Using Let's Encrypt?
If you're using Let's Encrypt certificates, you can set this to a lower value, like 20 days, because most of the automated renewal tools will renew the certificate at least 30 days before the expiry date, so you will be notified only if something goes wrong with the automated renewal process.
Latency history enabled
2.0.0
true
boolean
Whether the latency history is enabled or not. If it's disabled, the monitor won't record the measured latency. If you disable it on a monitor that has already recorded latency history, the existing history will be deleted.
Request method
2.0.0
GET
enum: GET, HEAD
The HTTP method to use for the uptime checks. HEAD is recommended for most cases, but not every endpoint supports it, so you can use GET if you need to.
More method to come in the future...
Follow redirects
2.0.0
true
boolean
Whether the monitor should follow redirects or not. If it's disabled, the monitor will not follow HTTP redirects (3xx responses) and will only check the initial URL. Multiple redirects will be followed, and the final response will be checked, however if a redirect loop is detected, the monitor will fail and alert you about it.
Force no-cache header
2.0.0
true
boolean
Whether the monitor should send a Cache-Control: no-cache header with the request. This is useful to ensure that the response is not cached by the server or any intermediate proxies, and you always get the latest response.
Integrations
2.0.0 empty list
A list of integrations to assign to the monitor.
If you're using YAML, or the API, the format is "{type}:{name}", where type is the alias of the integration (e.g. email, slack, etc.), and name is the name of the integration as defined in the integrations section of your YAML file. Example: email:my-email-integration.
Tip
You can add/keep disabled integrations in the list, but they will not be used for the monitor. This is useful if you want to enable them later without modifying the monitor's configuration.
Global integrations can be explicitly added too, which is handy if you're about to make them non-global later, but you want to make sure that they will be assigned to certain monitors even after the change.
Common operations
Toggling a monitor
You can enable or disable a monitor at any time, which will toggle the whole monitor, including the SSL checks and latency history. This is useful if you want to temporarily stop monitoring a specific endpoint without deleting it.
Disabled monitors won't be counted in the cumulated metrics, like uptime ratio.
Deleting a monitor
If you delete a monitor, it will be removed from the database, and all of its recorded events and metrics (i.e. latency history, uptime checks, etc.) will be deleted as well. This is a destructive operation, so make sure you really want to delete the monitor.
Look for the delete button with the sign next to the monitor you want to delete.
Remove the monitor from your YAML file, and then restart Kuvasz to apply the changes.
Use the DELETE /api/v1/monitors/{id} endpoint to delete the monitor by its ID.
Modifying the assigned integrations
You can modify the assigned integrations of a monitor by clicking on the configure button with the sign on the monitor's detail page (look for the Integrations block), where you can add or remove integrations as needed.
Modify the integrations property of your affected monitor, by adding or removing list items, and then restart Kuvasz to apply the changes.