HTTP & SSL monitors
Before you start...
Make sure that you carefully read the common documentation about managing the monitors!
Management methods
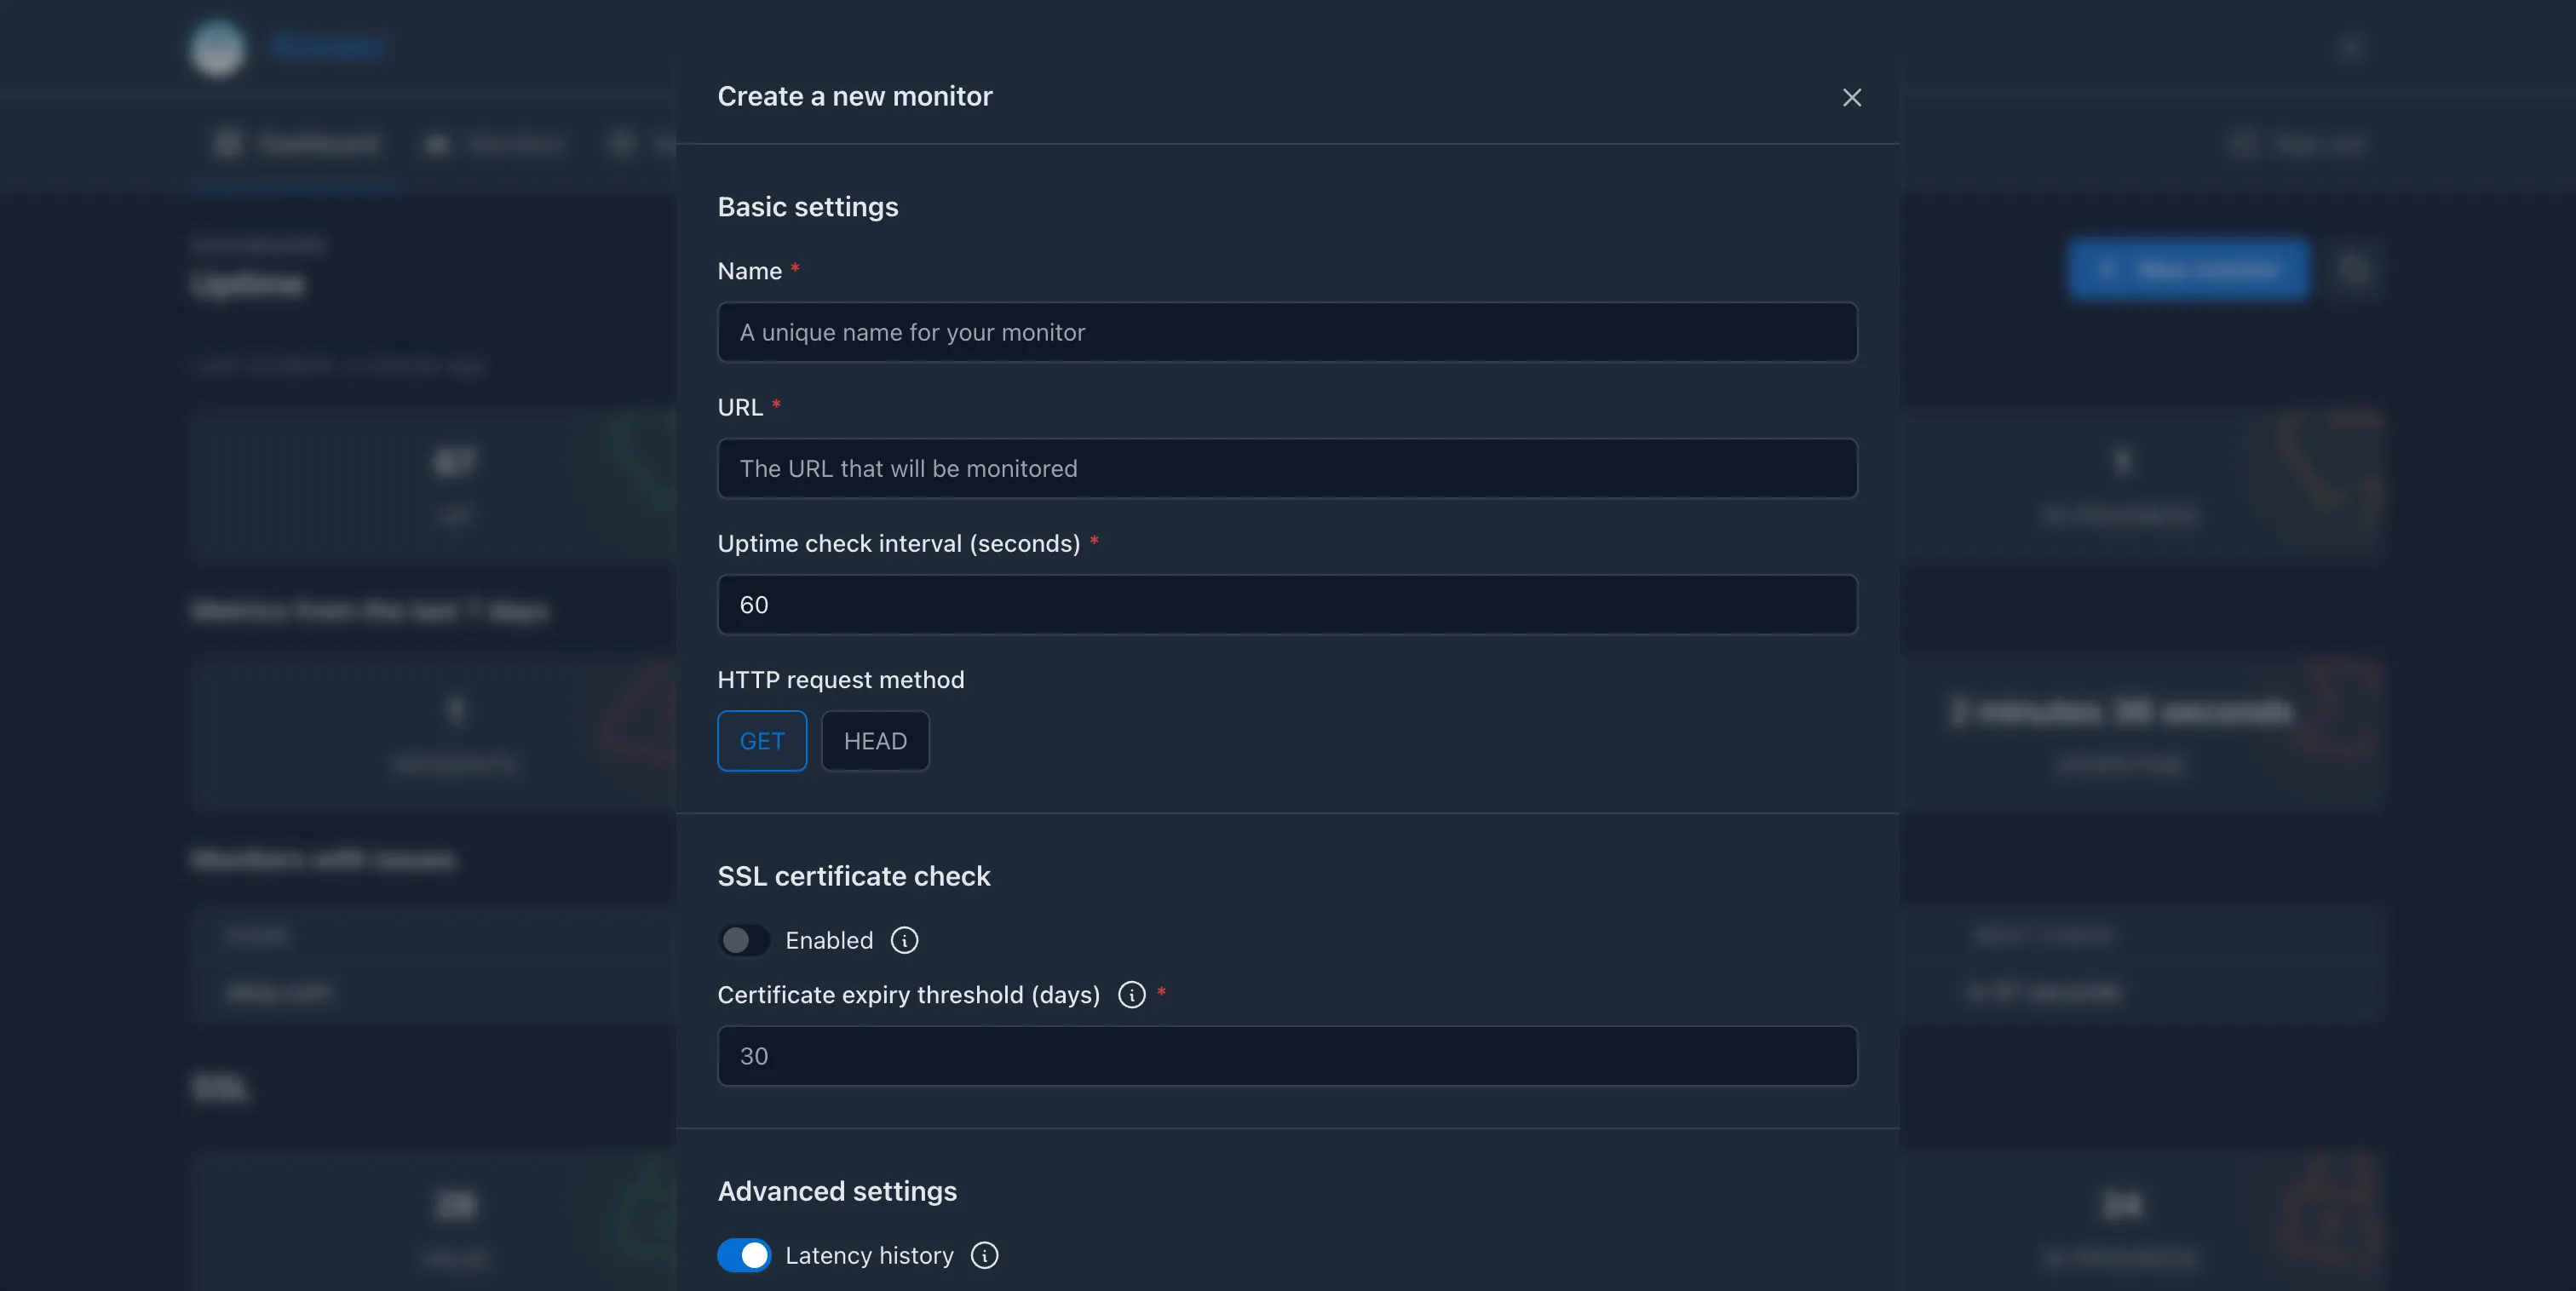
If you navigate to the Web UI of Kuvasz, you can create a new monitor on the Dashboard, or on the HTTP & SSL monitors page, by clicking the "+ New Monitor" button in the page header.
http-monitors:
- name: "My Monitor" # (1)!
  url: "https://kuvasz-uptime.dev" # (2)!
  sensitive-url: false # (21)!
  uptime-check-interval: 60 # (3)!
  enabled: true # (4)!
  ssl-check-enabled: false # (5)!
  latency-history-enabled: true # (6)!
  request-method: "GET" # (7)!
  follow-redirects: true # (8)!
  force-no-cache: true # (9)!
  ssl-expiry-threshold: 30 # (10)!
  failure-count-threshold: 1 # (20)!
  expected-status-codes: # (12)!
    - 200
    - 201
    - 303
  expected-keyword: "Kuvasz" # (13)!
  expected-keyword-case-sensitive: false # (14)!
  expected-keyword-negated: false # (15)!
  response-time-threshold-millis: 500 # (16)!
  request-headers: # (17)!
    Host: "example.com"
  expected-headers: # (18)!
    Content-Type: "application/json"
  request-body: "{\"key\":\"value\"}" # (19)!
  integrations: # (11)!
    - "email:my-email-integration"
# ... other monitors
- Name: The name of the monitor, which must be unique.
- URL: The URL of the monitor, which is the endpoint that will be monitored.
- Uptime check interval: The interval in seconds at which the uptime checks will be performed. The minimum value is 5 seconds.
- Enabled: Whether the monitor is enabled or not. If it's disabled, it won't be checked, and no events will be recorded for it.
- SSL check enabled: Whether the SSL check is enabled or not. If it's disabled, the monitor won't check the SSL certificate.
- Latency history enabled: Whether the latency history is enabled or not. If it's disabled, the monitor won't record latency history.
- Request method: The HTTP method to use for the uptime checks (e.g. GET, HEAD, etc.). Defaults to GET.
- Follow redirects: Whether the monitor should follow redirects or not. Defaults to true.
- Force no cache: Whether the monitor should send a
Cache-Control: no-cacheheader with the request. Defaults to true. - SSL expiry threshold: The number of days before the SSL certificate expires that the monitor should alert about it. Defaults to 30 days.
- Integrations: A list of integrations to assign to the monitor. The format is
"{integration-type}:{integration-name}", whereintegration-typeis the type of the integration (e.g.email,slack, etc.), andintegration-nameis the name of the integration as defined in theintegrationssection of your YAML file. Example:email:my-email-integration. - Expected status codes: A list of expected HTTP status codes that the monitor should accept as valid responses. Defaults to any
2xxstatus, see supported codes. - Expected keyword: A keyword that the monitor should look for in the response body. If the keyword is not found, the monitor will alert you about it.
- Expected keyword case sensitive: Whether the keyword matching should be case-sensitive or not. Defaults to false.
- Expected keyword negated: Whether the keyword matching should be negated or not. If set to true, the monitor will alert you if the keyword is found in the response body. Defaults to false.
- Response time threshold: The maximum response time in milliseconds that the monitor should accept. If the response time is higher than this value, the monitor will alert you about it. Maximum is 30 seconds (30000 ms), default is
nullwhich means that there is no response time threshold. - Request headers: A map of request headers to send with the request. This is useful if you need to set specific headers for the request, like
Host,Authorization, etc. - Expected headers: A map of expected response headers that the monitor should check for in the response.
- Request body: The JSON request body to send with the request.
- Failure count threshold: The number of consecutive failures that should occur before the monitor is considered down. Defaults to 1.
- Sensitive URL: Whether the URL of the monitor is considered sensitive or not. If it's set to
true, the URL will be masked in the metrics, logs and notifications/integrations.
This section won't go into details about the API or about exact API calls, since it's well documented and must be self-explanatory. You can find more information about the available endpoints and their usage in the API documentation.
However, here are few of the most important endpoints:
GET /api/v2/http-monitors– List all HTTP monitorsGET /api/v2/http-monitors/{id}– Get a specific HTTP monitor by its IDPOST /api/v2/http-monitors– Create a new HTTP monitorPATCH /api/v2/http-monitors/{id}– Update an existing HTTP monitorDELETE /api/v2/http-monitors/{id}– Delete an HTTP monitor
Basic settings
Name
The name of the monitor, which must be unique across all HTTP monitors.
URL
The URL of the monitor, which is the endpoint that will be monitored. It can be an HTTP or HTTPS URL.
Sensitive URL
3.6.0
false
boolean
sensitive-url
Whether the URL of the monitor is considered sensitive or not. If it's set to true, the URL will be masked in the metrics, logs and notifications/integrations to prevent accidental exposure of sensitive information like tokens, API keys, etc.
Uptime check interval
The interval in seconds at which the uptime checks will be performed. The minimum value is 5 seconds.
Tip
If you would like to use a low uptime check interval with possibly slow targets, you might take a look at the global read timeout setting to make sure that the slow response times won't defer your consecutive checks.
Enabled
Whether the monitor is enabled or not. If it's disabled, it won't be checked, and no events will be recorded for it. Also disables SSL checks, because it toggles the whole monitor.
Latency history enabled
2.0.0
true
boolean
latency-history-enabled
Whether the latency history is enabled or not. If it's disabled, the monitor won't record the measured latency. If you disable it on a monitor that has already recorded latency history, the existing history will be deleted.
Request settings
Request method
2.0.0
GET
enum
request-method
The HTTP method to use for the uptime checks.
Supported methods
The supported methods are:
Consequences of certain methods
- If you use the
HEADmethod, the response body will be empty, so the expected keyword check will always fail. - If you would like to send a request body, you must use the
POST,PUT, orPATCHmethods.
Follow redirects
2.0.0
true
boolean
follow-redirects
Whether the monitor should follow redirects or not. If it's disabled, the monitor will not follow HTTP redirects (3xx responses) and will only check the initial URL. Multiple redirects will be followed, and the final response will be checked, however if a redirect loop is detected, the monitor will fail and alert you about it.
Force no-cache header
2.0.0
true
boolean
force-no-cache
Whether the monitor should send a Cache-Control: no-cache header with the request. This is useful to ensure that the response is not cached by the server or any intermediate proxies, and you always get the latest response.
Request headers
2.5.0
map
request-headers
A set of request headers to send with the request. This is useful if you need to set specific headers for the request, like Host, Authorization, etc. The headers will be sent as-is, without any parsing, the only requirement is that the keys must be valid HTTP header names as defined by RFC 9110 (see the ABNF grammar for a token, Sections 5.1 and 5.6.2) : It must contain one or more letter, or digit, or the following symbol :
Default headers
Kuvasz will automatically add the following headers to every request:
User-Agent:Kuvasz Uptime Checker/2 https://github.com/kuvasz-uptime/kuvaszAccept:*/*Accept-Encoding:gzip, deflate, br(only if there is no keyword matcher defined)Host: the host part of the URL being monitoredCache-Control:no-cache(if the force no-cache header option is enabled)
If you define any of these headers along your custom request headers, they will be overridden by your values!
Request body
2.5.0
string
request-body
The JSON request body to send with the request. This is useful if you need to send a specific payload with the request. The body will be sent as-is, without any sanitization, trimming or parsing, the only requirement is that it must be a valid JSON string.
Supported request methods: POST, PUT and PATCH
Info
If you use one of the supported request methods and you don't provide a request body, an empty JSON object ({}) will be sent as the request body by default.
Evaluation settings
Expected status codes
2.4.0
every 2xx code
list
expected-status-codes
A list of expected HTTP status codes that the monitor should accept as valid responses. If the response status code is not in this list, the monitor will alert you about it. Defaults to any 2xx status code.
Supported status codes
Informational:
100Continue101Switching Protocols102Processing103Early Hints
Success:
200Ok201Created202Accepted203Non-Authoritative Information204No Content205Reset Content206Partial Content207Multi Status208Already Imported226IM Used
Redirection:
300Multiple Choices301Moved Permanently302Found303See Other304Not Modified305Use Proxy306Switch Proxy307Temporary Redirect308Permanent Redirect
Client Error:
400Bad Request401Unauthorized402Payment Required403Forbidden404Not Found405Method Not Allowed406Not Acceptable407Proxy Authentication Required408Request Timeout409Conflict410Gone411Length Required412Precondition Failed413Request Entity Too Large414Request-URI Too Long415Unsupported Media Type416Requested Range Not Satisfiable417Expectation Failed418I am a teapot (RFC 7168)420Enhance your calm (Twitter)421Misdirected Request (RFC 7540)422Unprocessable Entity (WebDAV; RFC 4918)423Locked (WebDAV; RFC 4918)424Failed Dependency (WebDAV; RFC 4918)425Too Early (RFC 8470)426Upgrade Required (RFC 7231)428Precondition Required (RFC 6585)429Too Many Requests (RFC 6585)431Request Header Fields Too Large (RFC 6585)444No Response450Blocked by Windows Parental Controls (Microsoft)451Unavailable For Legal Reasons (RFC 7725)494Request Header Too Large
Redirects
If the monitor is set to follows redirects, every intermediate request's status code will be checked against this list.
Therefore if you want to allow redirects, and you would also like to explicitly specify the expected status codes, you have to add the right 3xx status codes to this list as well, otherwise the monitor will alert you about the redirect responses.
For example: you have a monitor that checks a URL that redirects to another URL with a 307 Temporary Redirect, and the final request is expected to return a 204 No Content response. In this case you need to do the following:
- enable the following redirects option
- add
307and204to theexpected-status-codeslist
Expected keyword
2.4.0
string
expected-keyword
A keyword that the monitor should look for in the response body. If the keyword is not found, the monitor will alert you about it. This is useful to ensure that the response contains the expected content. You can use JSON strings as well, for example {"status":"ok"} to match a JSON response, but keep in mind, that Kuvasz will check the response as is, without parsing it, so the keyword must match exactly.
HEAD requests
If the monitor is set to use the HEAD request method, the response body will be empty, so this check will always fail. In this case, you should either use the GET method, or disable this check.
Expected keyword case sensitivity
2.4.0
false
boolean
expected-keyword-case-sensitive
Whether the keyword matching should be case-sensitive or not. If it's set to true, the monitor will be considered healthy only if the keyword matches exactly, including the case. If it's set to false, the monitor will be considered healthy if the keyword is found in the response body, regardless of the case.
Expected keyword negation
2.4.0
false
boolean
expected-keyword-negated
A.k.a. "reverse matching". If this is set to true, the monitor will alert you if the keyword is found in the response body, instead of alerting you if it's not found. This is useful if you want to ensure that a specific keyword is not present in the response body.
Response time threshold
2.4.0
number
response-time-threshold-millis
The maximum response time in milliseconds that the monitor should accept. If the response time is higher than this value, the monitor will alert you about it. This is useful to ensure that your services are performing well and responding within an acceptable time frame. The maximum value is 30 seconds (30000 ms), and the default is null, which means that there is no response time threshold.
Warning
Keep in mind that there is another configuration option that could interfere with the monitor's response time threshold, the global read timeout setting. If the global value is lower than the monitor's response time threshold, than the global one will be effective.
Expected headers
2.5.0
map
expected-headers
A set of expected response headers that the monitor should check for in the response. If any of the expected headers are missing or have different values, the monitor will alert you about it. The header names will be checked in a case-insensitive manner, but the values will be checked as-is, without any parsing, trimming or normalization. The keys must be valid HTTP header names as defined by RFC 9110 (see the ABNF grammar for a token, Sections 5.1 and 5.6.2) : It must contain one or more letter, or digit, or the following symbol :
Failure count threshold
3.5.0
1
number
failure-count-threshold
The number of consecutive failures that should occur before the monitor is considered down. Defaults to 1, which means that the monitor will be considered down after the first failure. If you set it to a higher value, for example 3, the monitor will be considered down only after 3 consecutive failures, which can help to reduce false positives in case of temporary network issues or other transient problems.
SSL check settings
SSL check enabled
false
boolean
ssl-check-enabled
Whether the SSL check is enabled or not. If it's disabled, the monitor won't check the SSL certificate. This setting is probably only relevant for HTTPS URLs.
SSL expiry threshold
2.0.0
30
number
ssl-expiry-threshold
The number of days before the SSL certificate expires that the monitor should alert about it. Minimum value is 0, which mean that the monitor will alert you only on the day of the expiry.
Using Let's Encrypt?
If you're using Let's Encrypt certificates, you can set this to a lower value, like 20 days, because most of the automated renewal tools will renew the certificate at least 30 days before the expiry date, so you will be notified only if something goes wrong with the automated renewal process.
Integrations
2.0.0
empty
list
integrations
A list of integrations to assign to the monitor.
If you're using YAML, or the API, the format is "{type}:{name}", where type is the alias of the integration (e.g. email, slack, etc.), and name is the name of the integration as defined in the integrations section of your YAML file. Example: email:my-email-integration.
Tip
You can add/keep disabled integrations in the list, but they will not be used for the monitor. This is useful if you want to enable them later without modifying the monitor's configuration.
Global integrations can be explicitly added too, which is handy if you're about to make them non-global later, but you want to make sure that they will be assigned to certain monitors even after the change.
Common operations
Toggling a monitor
You can enable or disable a monitor at any time, which will toggle the whole monitor, including the SSL checks and latency history. This is useful if you want to temporarily stop monitoring a specific endpoint without deleting it.
Disabled monitors won't be counted in the cumulated metrics, like uptime ratio.
Deleting a monitor
If you delete a monitor, it will be removed from the database, and all of its recorded events and metrics (i.e. latency history, uptime checks, etc.) will be deleted as well. This is a destructive operation, so make sure you really want to delete the monitor.
Look for the delete button with the sign next to the monitor you want to delete.
Remove the monitor from your YAML file, and then restart Kuvasz to apply the changes.
Use the DELETE /api/v2/http-monitors/{id} endpoint to delete the monitor by its ID.
Modifying the assigned integrations
You can modify the assigned integrations of a monitor by clicking on the configure button with the sign on the monitor's detail page (look for the Integrations block), where you can add or remove integrations as needed.
Modify the integrations property of your affected monitor, by adding or removing list items, and then restart Kuvasz to apply the changes.