Status pages
Status pages are one of the key features of a proper monitoring system. They help you communicate the status of your services to your customers or internal teams, and can also be used to display historical uptime and incident information.
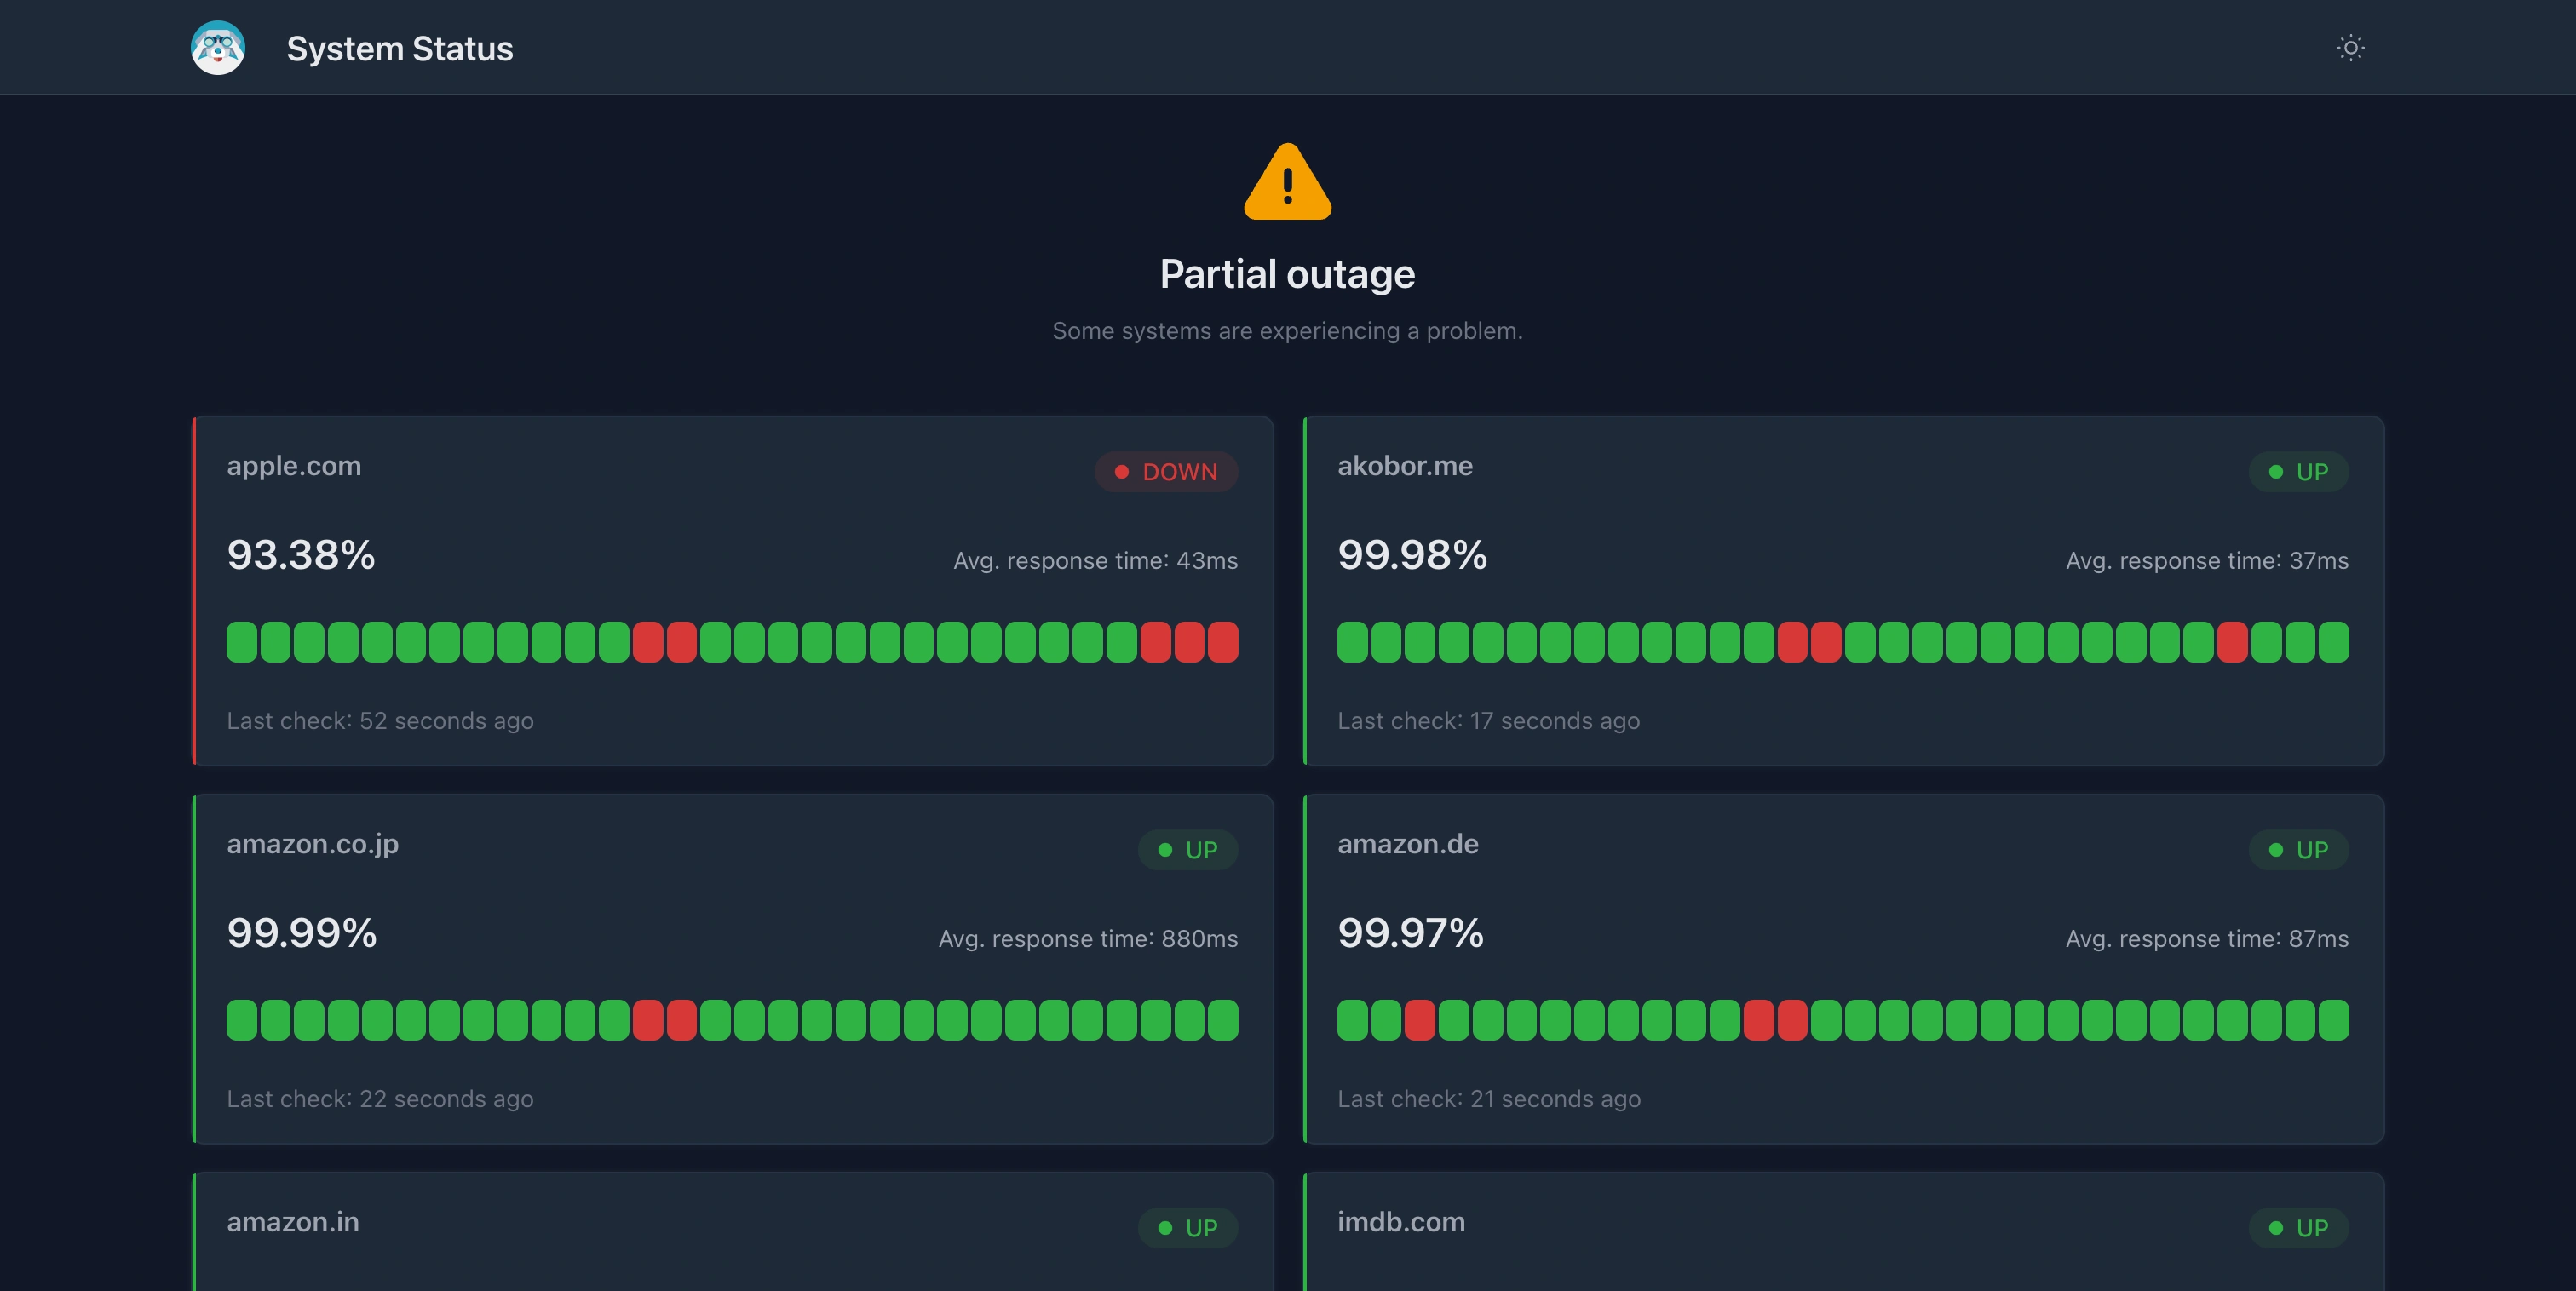
An example status page
You can see a live demo of the publicly available, default status page created with Kuvasz at the demo site under https://demo.kuvasz-uptime.dev/status.
What can be configured?
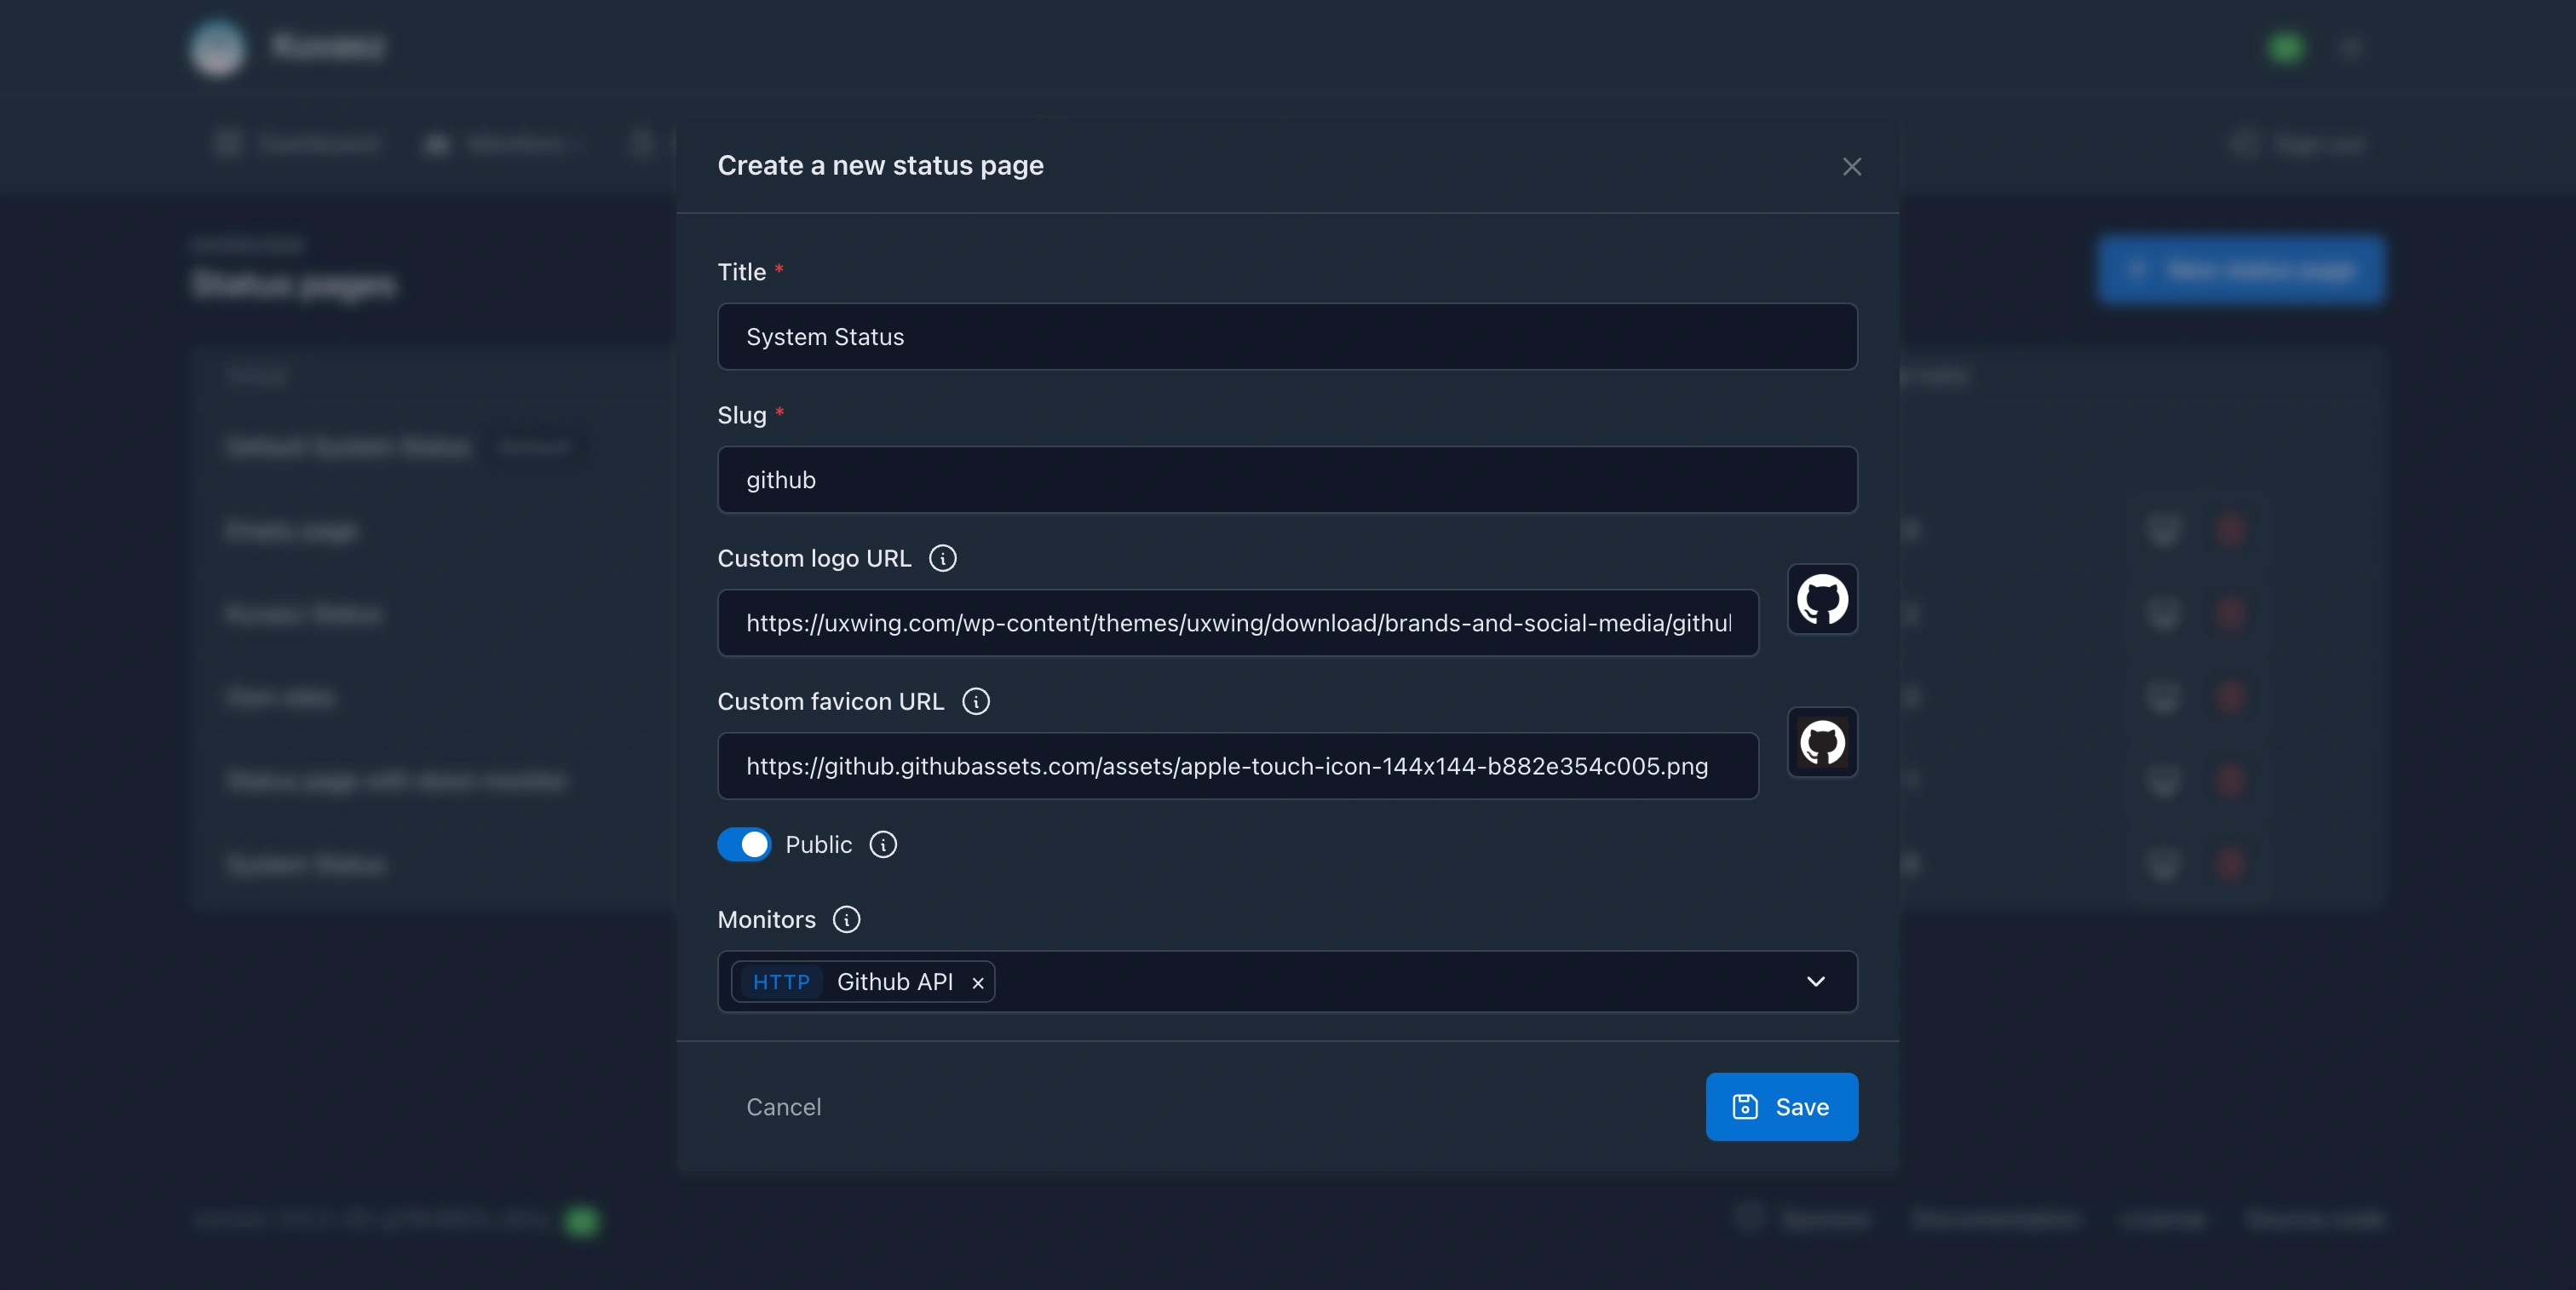
There are two types of status pages available: the default, built-in one, that contains every enabled monitors automatically. The other type is a custom status page, which allows you to select the monitors you would like to display. Both types supports the following features:
- Public or private access: You can choose to make your status page public, or make it available only to authenticated users.
- Custom logo and favicon: You can reference your own logo and favicon to match your branding.
- Custom title and slug: You can set a custom title and URL for your status page.
- Historical statistics from the last 30 days:
- uptime percentage
- average response time (a.k.a. "latency") if recorded
- number of incidents per day
- Server-side caching: To improve performance, status pages are cached on the server-side. You can configure the cache duration to balance between performance and data freshness.
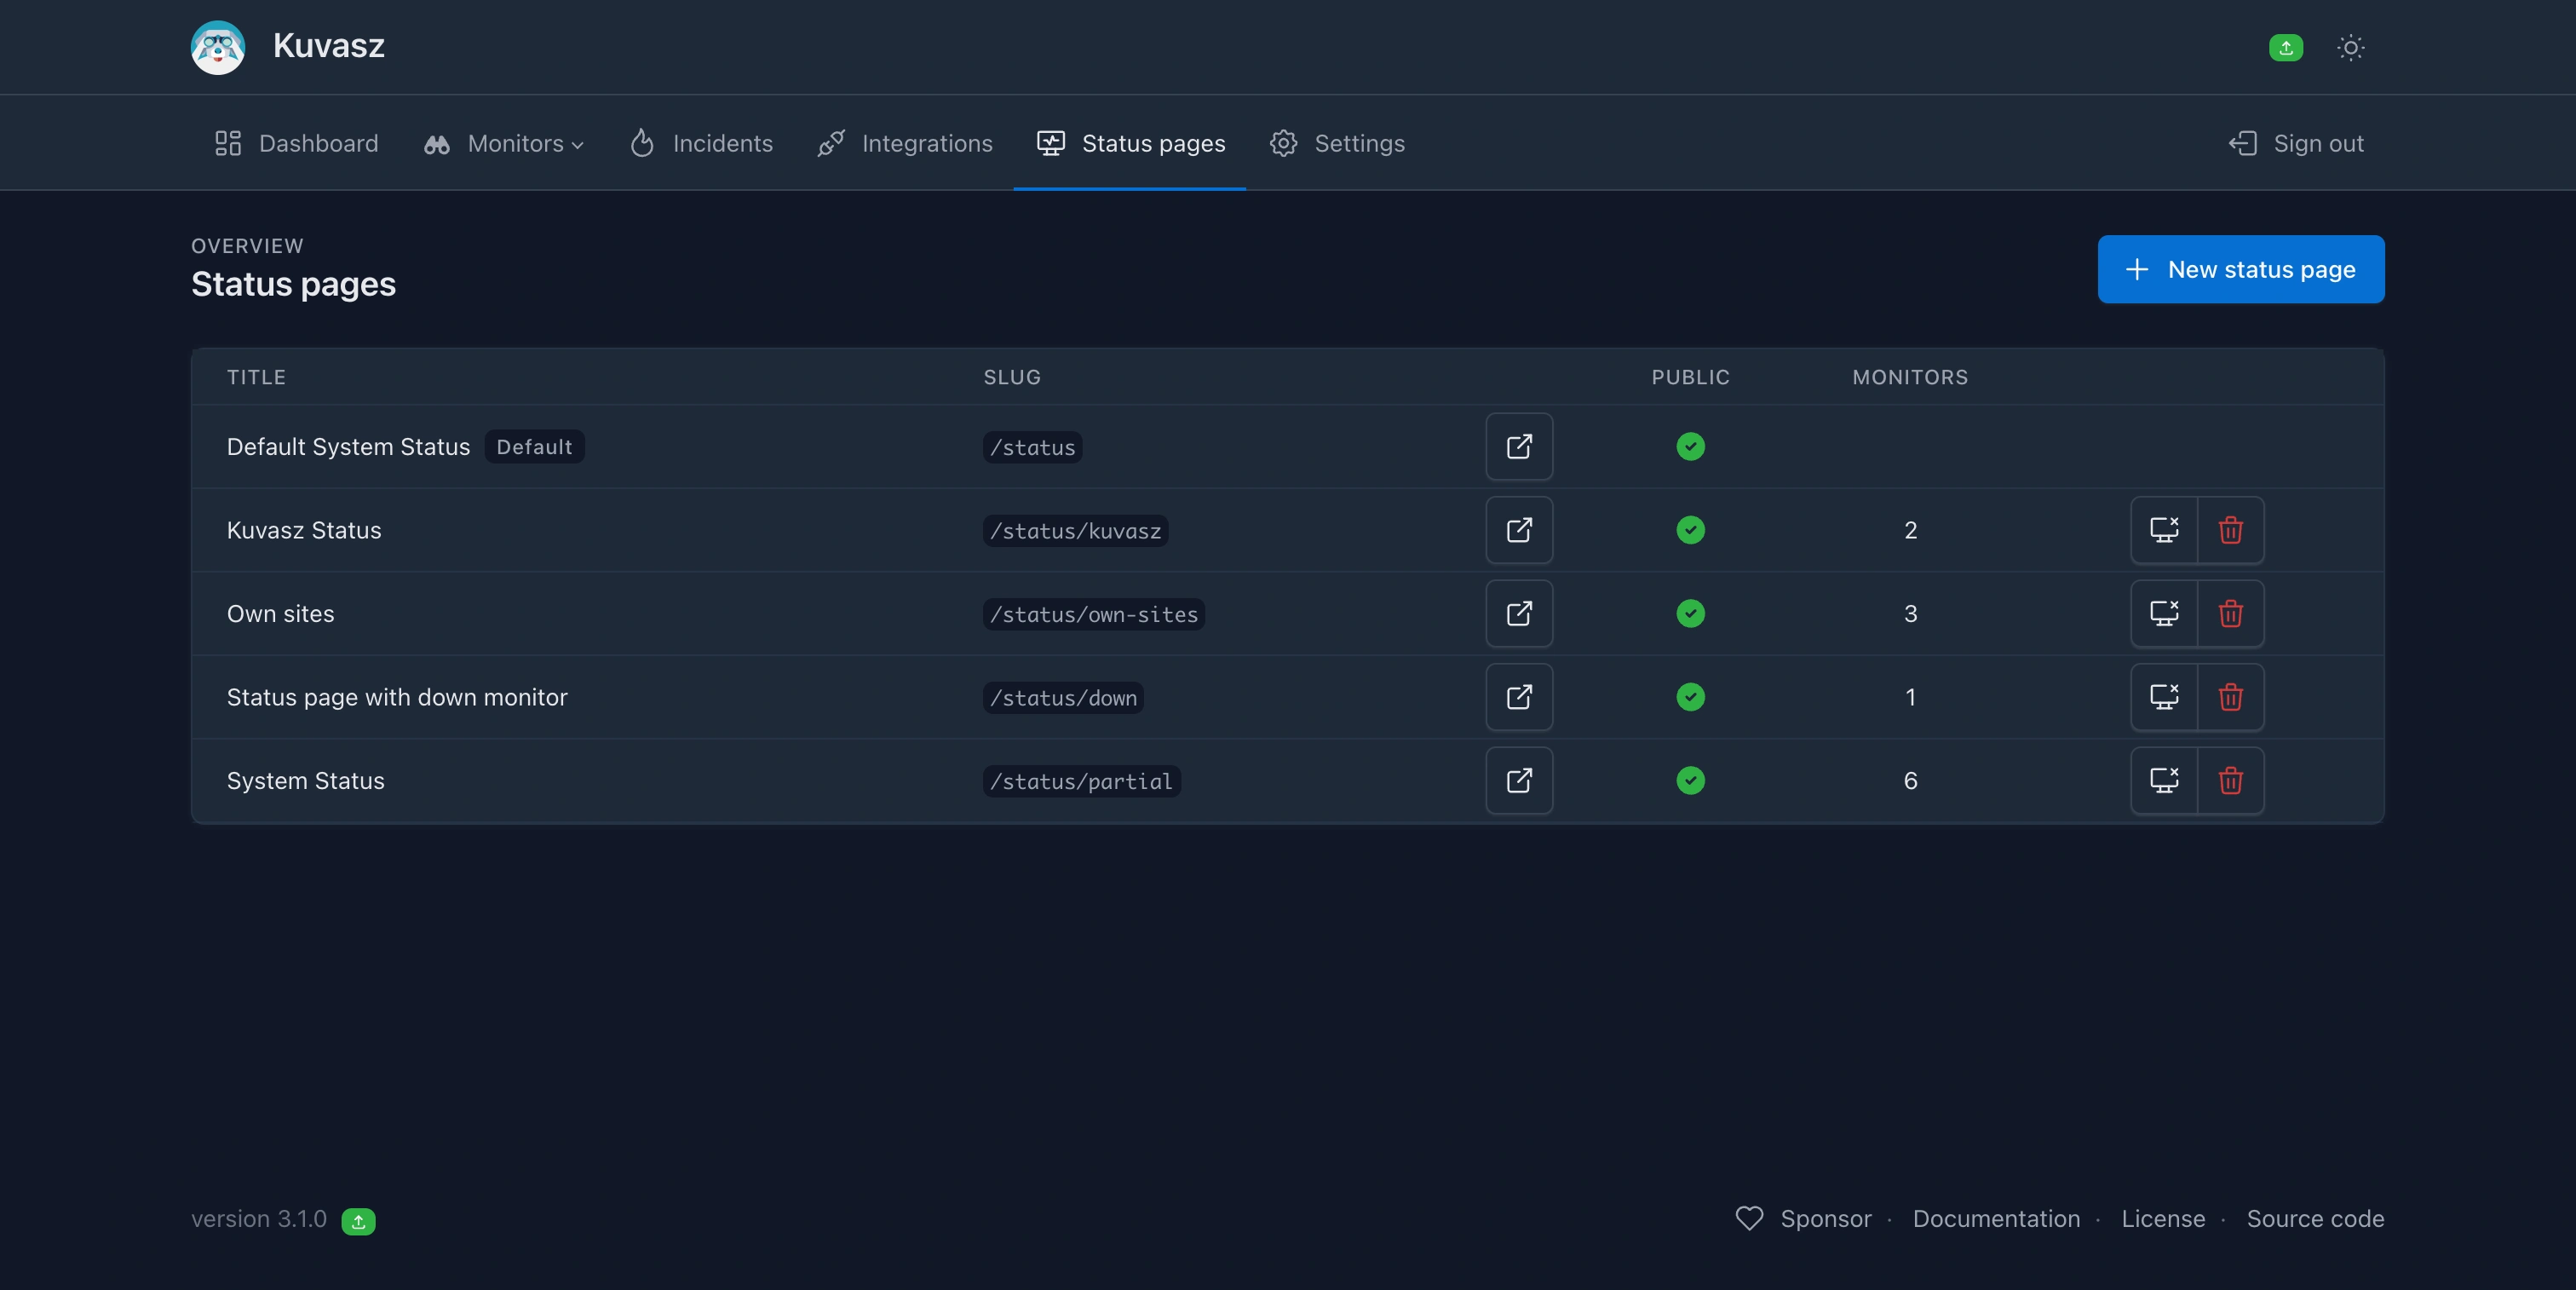
Tip
You can choose how would like to manage your status pages: via the Web UI, the REST API, or with a YAML configuration file. For more information, please refer to the Status pages management section of the documentation.