Metrics exporters
Kuvasz supports exporting metrics to allow you to integrate with your existing monitoring and alerting systems. This way you can use Kuvasz alongside your preferred observability stack, so you can introduce it to your infrastructure step by step.
Enabling the export
2.1.0
false
boolean
The metrics export is disabled by default, to enable it, you need to change either your YAML configuration or your environment variables. Don't forget to restart the container in both cases!
Exported metrics
Currently the following metrics are exported, but all of them is disabled by default, you can enable them one by one, tailored to your needs.
Metrics have the following labels/tags, that you can use to filter/group them in your monitoring backend, but not every metric has all of them:
name: the name of the monitortarget: the target that is monitored (i.e. a URL, an IP address / hostname, ahost:portpair for TCP monitors, or ahost/containerpair for Docker monitors)
name |
target |
|
|---|---|---|
| HTTP uptime status | ✅ | ✅ |
| HTTP latest latency | ✅ | ✅ |
| SSL status | ✅ | ✅ |
| SSL expiry | ✅ | ✅ |
| Push uptime status | ✅ | ❌ |
| ICMP uptime status | ✅ | ✅ |
| ICMP latest latency | ✅ | ✅ |
| ICMP packet loss | ✅ | ✅ |
| TCP uptime status | ✅ | ✅ |
| TCP latest latency | ✅ | ✅ |
| DNS uptime status | ✅ | ✅ |
| DNS latest latency | ✅ | ✅ |
| Docker uptime status | ✅ | ✅ |
| Docker API latest latency | ✅ | ✅ |
| Docker container CPU usage | ✅ | ✅ |
| Docker container memory usage | ✅ | ✅ |
| Docker container restart count | ✅ | ✅ |
HTTP uptime status
2.1.0
false
boolean
This metric is exported as a gauge and indicates the current uptime status of the monitored HTTP services.
| Status | Gauge value |
|---|---|
| UP | 1 |
| DOWN | 0 |
HTTP latest latency
2.1.0
false
boolean
This metric is exported as a gauge and reports the latest recorded latency of the monitored HTTP endpoint, in milliseconds.
SSL status
2.1.0
false
boolean
This metric is exported as a gauge and indicates the current status of the SSL certificate of the monitored endpoint (only if SSL checks are enabled).
| Status | Gauge value |
|---|---|
| VALID, WILL_EXPIRE | 1 |
| INVALID | 0 |
SSL expiry
2.1.0
false
boolean
This metric is exported as a gauge and reports the expiry date (as a Unix timestamp) of the SSL certificate of the monitored endpoint (only if SSL checks are enabled).
Push uptime status
3.2.0
false
boolean
This metric is exported as a gauge and indicates the current uptime status of the given push (heartbeat) monitor.
| Status | Gauge value |
|---|---|
| UP | 1 |
| DOWN | 0 |
ICMP uptime status
3.10.0
false
boolean
This metric is exported as a gauge and indicates the current uptime status of the given ICMP (ping) monitor.
| Status | Gauge value |
|---|---|
| UP | 1 |
| DOWN | 0 |
ICMP latest latency
3.10.0
false
boolean
This metric is exported as a gauge and reports the latest recorded average round-trip latency of the monitored host, in milliseconds.
ICMP packet loss
3.10.0
false
boolean
This metric is exported as a gauge and reports the latest recorded packet loss percentage (0-100) of the monitored host.
TCP uptime status
4.2.0
false
boolean
This metric is exported as a gauge and indicates the current uptime status of the given TCP (port) monitor.
| Status | Gauge value |
|---|---|
| UP | 1 |
| DOWN | 0 |
TCP latest latency
4.2.0
false
boolean
This metric is exported as a gauge and reports the latest recorded connect latency of the monitored host:port endpoint, in milliseconds.
DNS uptime status
4.2.0
false
boolean
This metric is exported as a gauge and indicates the current uptime status of the given DNS monitor.
| Status | Gauge value |
|---|---|
| UP | 1 |
| DOWN | 0 |
DNS latest latency
4.2.0
false
boolean
This metric is exported as a gauge and reports the latest recorded resolution latency of the monitored name, in milliseconds. The target tag is the queried host.
Docker uptime status
4.5.0
false
boolean
This metric is exported as a gauge and indicates the current uptime status of the given Docker monitor. The target tag is the Docker host and the container, in a host/container format.
| Status | Gauge value |
|---|---|
| UP | 1 |
| DOWN | 0 |
Docker API latest latency
4.5.0
false
boolean
This metric is exported as a gauge and reports the latest recorded round-trip of the container inspection to the Docker daemon, in milliseconds. It measures the daemon, not the container, which is useful for keeping an eye on a remote Docker host.
Docker container CPU usage
4.5.0
false
boolean
This metric is exported as a gauge and reports the latest sampled CPU usage of the container, as a percentage, in the same terms docker stats reports it (so a container using two full cores reports 200). It's only available for monitors with metrics history enabled.
It's only reported while there is a fresh sample: once the monitor goes down, or a check fails to sample the container, the series is removed until the next successful sample, instead of repeating the last reading of a container that may have stopped since.
Docker container memory usage
4.5.0
false
boolean
This metric is exported as a gauge and reports the latest sampled memory usage of the container in bytes, excluding the page cache, the same way docker stats does it. It's only available for monitors with metrics history enabled.
Like the CPU usage, it's only reported while there is a fresh sample.
Docker container restart count
4.5.0
false
boolean
This metric is exported as a gauge and reports how many times the restart policy of the container has restarted it, as the latest check found it. The count is updated by every check that records an UP or DOWN event, so unlike the resource metrics it doesn't need metrics history. While a failing check is still below the failure count threshold, it records no event, so the metric only catches up with the restarts at the next one.
A manual restart, or recreating the container resets the count to zero. When a check can't inspect the container (e.g. the daemon is unreachable), the last known count is kept, instead of the metric disappearing.
Prometheus
The Prometheus exporter is a built-in exporter that allows you to expose your metrics in a format that can be scraped by Prometheus. It supports the standard Prometheus text format, which is widely used for monitoring and alerting.
Settings
Enabling the exporter
2.1.0
false
boolean
Descriptions
2.1.0
true
boolean
Whether meter descriptions should be exposed to Prometheus. Disable to minimize the amount of data sent on each scrape.
Scraping the metrics
The metrics are scrapeable through the /api/v2/prometheus endpoint, and you'll need to use your API key by default to access it, just like on any other API endpoint. In case you have disabled the authentication, the endpoint will be available without authentication, of course.
Example output
kuvasz_http_uptime_status{name="nytimes.com",target="https://www.nytimes.com"} 1.0
kuvasz_http_latency_latest_milliseconds{name="nytimes.com",target="https://www.nytimes.com"} 29.0
kuvasz_http_ssl_status{name="nytimes.com",target="https://www.nytimes.com"} 1.0
kuvasz_http_ssl_expiry_seconds{name="nytimes.com",target="https://www.nytimes.com"} 1.758828296E9
kuvasz_icmp_uptime_status{name="my-router",target="192.168.1.1"} 1.0
kuvasz_icmp_latency_latest_milliseconds{name="my-router",target="192.168.1.1"} 4.0
kuvasz_icmp_packet_loss_latest_percentage{name="my-router",target="192.168.1.1"} 0.0
kuvasz_tcp_uptime_status{name="postgres",target="192.168.1.1:5432"} 1.0
kuvasz_tcp_latency_latest_milliseconds{name="postgres",target="192.168.1.1:5432"} 3.0
kuvasz_dns_uptime_status{name="example.com",target="example.com"} 1.0
kuvasz_dns_latency_latest_milliseconds{name="example.com",target="example.com"} 12.0
kuvasz_docker_uptime_status{name="my-app",target="local/my-app"} 1.0
kuvasz_docker_api_latency_latest_milliseconds{name="my-app",target="local/my-app"} 4.0
kuvasz_docker_cpu_usage_latest_percent{name="my-app",target="local/my-app"} 2.35
kuvasz_docker_memory_usage_latest_bytes{name="my-app",target="local/my-app"} 5.4525952E7
kuvasz_docker_restart_count{name="my-app",target="local/my-app"} 3.0
Example config
micronaut:
  metrics:
    enabled: true
    export:
      prometheus:
        enabled: true
        descriptions: true
---
metrics-exports:
    http-uptime-status: true
    http-latest-latency: true
    ssl-status: true
    ssl-expiry: true
    push-uptime-status: true
    icmp-uptime-status: true
    icmp-latest-latency: true
    icmp-latest-packet-loss: true
    tcp-uptime-status: true
    tcp-latest-latency: true
    dns-uptime-status: true
    dns-latest-latency: true
    docker-uptime-status: true
    docker-latest-latency: true
    docker-latest-cpu-usage: true
    docker-latest-memory-usage: true
    docker-latest-restart-count: true
ENABLE_METRICS_EXPORT=true
ENABLE_PROMETHEUS_EXPORT=true
ENABLE_PROMETHEUS_DESCRIPTIONS=true
# Enable the individual metrics
ENABLE_HTTP_UPTIME_STATUS_EXPORT=true
ENABLE_HTTP_LATEST_LATENCY_EXPORT=true
ENABLE_SSL_STATUS_EXPORT=true
ENABLE_SSL_EXPIRY_EXPORT=true
ENABLE_PUSH_UPTIME_STATUS_EXPORT=true
ENABLE_ICMP_UPTIME_STATUS_EXPORT=true
ENABLE_ICMP_LATEST_LATENCY_EXPORT=true
ENABLE_ICMP_LATEST_PACKET_LOSS_EXPORT=true
ENABLE_TCP_UPTIME_STATUS_EXPORT=true
ENABLE_TCP_LATEST_LATENCY_EXPORT=true
ENABLE_DNS_UPTIME_STATUS_EXPORT=true
ENABLE_DNS_LATEST_LATENCY_EXPORT=true
ENABLE_DOCKER_UPTIME_STATUS_EXPORT=true
ENABLE_DOCKER_LATEST_LATENCY_EXPORT=true
ENABLE_DOCKER_LATEST_CPU_USAGE_EXPORT=true
ENABLE_DOCKER_LATEST_MEMORY_USAGE_EXPORT=true
ENABLE_DOCKER_LATEST_RESTART_COUNT_EXPORT=true
OpenTelemetry
The OpenTelemetry exporter is a built-in exporter that allows you to export your metrics to any compatible tool, that supports the OpenTelemetry Protocol (OTLP). OpenTelemetry is a vendor-neutral standard for collecting and exporting telemetry data, and a lot of modern observability tools support it (e.g. Datadog, New Relic, etc.).
Info
Kuvasz will automatically report the metrics to the configured endpoint at the specified frequency.
Settings
Enabling the exporter
2.1.0
false
boolean
URL
The URL of the OpenTelemetry endpoint to which the metrics will be reported. It is mandatory to set this, if you've enabled the exporter.
Headers
2.1.0
string
The headers to be sent with the metrics export request. This is useful for authentication or other custom headers required by your OpenTelemetry collector. Multiple headers can be specified as a comma-separated list, in the format of key1=value1,key2=value2.
Step
2.1.0
PT1M
ISO-8601 duration
The frequency of exporting the metrics to OpenTelemetry. The default is 1 minute. More about ISO-8601 durations here.
Example output
kuvasz.http.ssl.status{name=weather.com,target=https://weather.com} 1
kuvasz.http.latency.latest.milliseconds{name=samsung.com,target=https://www.samsung.com} 183
kuvasz.http.uptime.status{name=google.com,target=https://www.google.com} 1
kuvasz.http.ssl.expiry.seconds{name=bbc.com,target=https://www.bbc.com} 1.785147977e+09
kuvasz.icmp.uptime.status{name=my-router,target=192.168.1.1} 1
kuvasz.icmp.latency.latest.milliseconds{name=my-router,target=192.168.1.1} 4
kuvasz.icmp.packet.loss.latest.percentage{name=my-router,target=192.168.1.1} 0
kuvasz.tcp.uptime.status{name=postgres,target=192.168.1.1:5432} 1
kuvasz.tcp.latency.latest.milliseconds{name=postgres,target=192.168.1.1:5432} 3
kuvasz.dns.uptime.status{name=example.com,target=example.com} 1
kuvasz.dns.latency.latest.milliseconds{name=example.com,target=example.com} 12
kuvasz.docker.uptime.status{name=my-app,target=local/my-app} 1
kuvasz.docker.api.latency.latest.milliseconds{name=my-app,target=local/my-app} 4
kuvasz.docker.cpu.usage.latest.percent{name=my-app,target=local/my-app} 2.35
kuvasz.docker.memory.usage.latest.bytes{name=my-app,target=local/my-app} 54525952
Example config
micronaut:
  metrics:
    enabled: true
    export:
      otlp:
        enabled: true
        url: https://example.host:4318/v1/metrics
        headers: 'Authorization=Bearer Your-collectors-API-token,key2=value'
        step: PT1M
---
metrics-exports:
  http-uptime-status: true
  http-latest-latency: true
  ssl-status: true
  ssl-expiry: true
  push-uptime-status: true
  icmp-uptime-status: true
  icmp-latest-latency: true
  icmp-latest-packet-loss: true
  tcp-uptime-status: true
  tcp-latest-latency: true
  dns-uptime-status: true
  dns-latest-latency: true
  docker-uptime-status: true
  docker-latest-latency: true
  docker-latest-cpu-usage: true
  docker-latest-memory-usage: true
  docker-latest-restart-count: true
ENABLE_METRICS_EXPORT=true
ENABLE_OTLP_EXPORT=true
OTLP_EXPORT_URL=https://example.host:4318/v1/metrics
OTLP_EXPORT_HEADERS='Authorization=Bearer Your-collectors-API-token,key2=value'
OTLP_EXPORT_STEP=PT1M
# Enable the individual metrics
ENABLE_HTTP_UPTIME_STATUS_EXPORT=true
ENABLE_HTTP_LATEST_LATENCY_EXPORT=true
ENABLE_SSL_STATUS_EXPORT=true
ENABLE_SSL_EXPIRY_EXPORT=true
ENABLE_PUSH_UPTIME_STATUS_EXPORT=true
ENABLE_ICMP_UPTIME_STATUS_EXPORT=true
ENABLE_ICMP_LATEST_LATENCY_EXPORT=true
ENABLE_ICMP_LATEST_PACKET_LOSS_EXPORT=true
ENABLE_TCP_UPTIME_STATUS_EXPORT=true
ENABLE_TCP_LATEST_LATENCY_EXPORT=true
ENABLE_DNS_UPTIME_STATUS_EXPORT=true
ENABLE_DNS_LATEST_LATENCY_EXPORT=true
ENABLE_DOCKER_UPTIME_STATUS_EXPORT=true
ENABLE_DOCKER_LATEST_LATENCY_EXPORT=true
ENABLE_DOCKER_LATEST_CPU_USAGE_EXPORT=true
ENABLE_DOCKER_LATEST_MEMORY_USAGE_EXPORT=true
ENABLE_DOCKER_LATEST_RESTART_COUNT_EXPORT=true
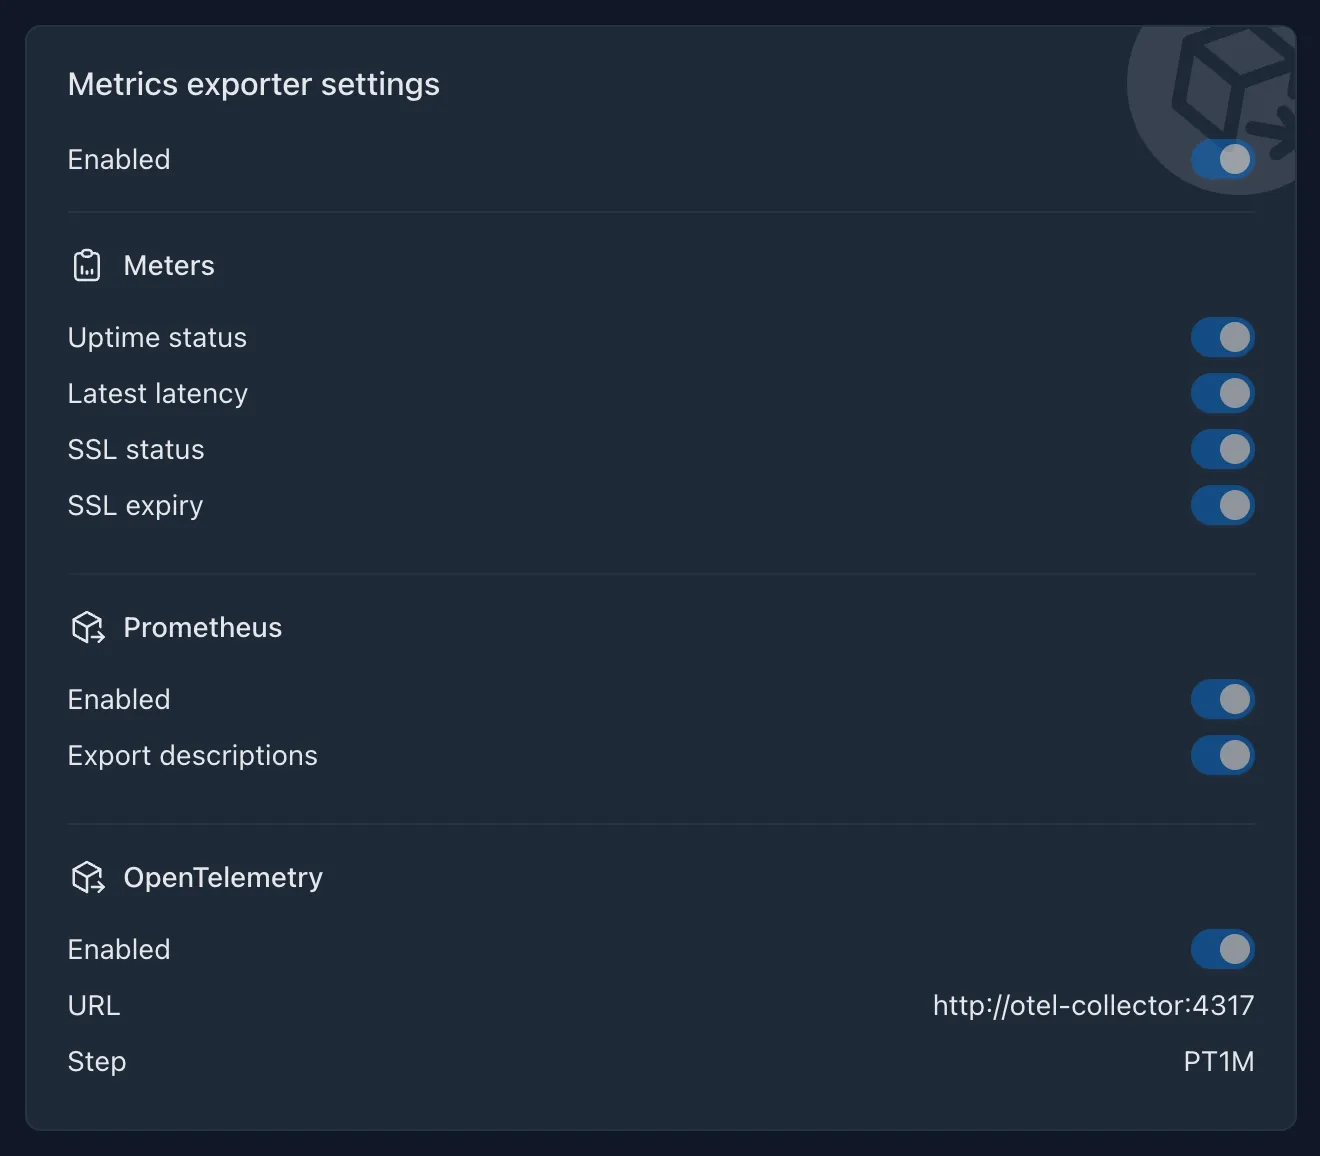
Checking the configuration on the UI
You can check the effective configuration of the metrics exporters on the UI, by navigating to the Settings page, where you'll find an overview of all the available settings (except the ones that could contain sensitive data, e.g. the OpenTelemetry report's headers).