Recipes & examples
Enable trace logging of HTTP requests/responses
If you want to debug one of your monitors, you can enable trace logging of HTTP requests and responses. This will log all the requests and responses made by Kuvasz to your monitors. All you need to do is to add the following configuration to your YAML configuration file:
- You can also use
DEBUG, but it won't log the request and response bodies, only the headers and status codes.
Keeping secrets out of your configuration file
Your kuvasz.yml is a good candidate for version control, but it's also the place where quite a lot of sensitive data tends to end up: webhook URLs, PagerDuty integration keys, SMTP credentials, your OIDC client secret, and so on.
There are two built-in mechanisms to keep those out of the file you commit, and you can freely combine them.
Referencing environment variables from the YAML
Any value in your YAML configuration can reference an environment variable with the ${VARIABLE_NAME} syntax. This works everywhere, not only for the settings that have a dedicated environment variable, so it's a good fit for integrations, which can be configured only via the YAML file.
integrations:
  slack:
    - name: alerts
      webhook-url: ${SLACK_WEBHOOK_URL}
  pagerduty:
    - name: oncall
      integration-key: ${PAGERDUTY_INTEGRATION_KEY}
smtp-config:
  host: 'smtp.your-domain.com'
  port: ${SMTP_PORT:`465`} # (1)!
  username: 'kuvasz@your-domain.com'
  password: ${SMTP_PASSWORD}
- With the
${VARIABLE_NAME:fallback}syntax you can provide a default value that is used when the variable isn't set. Placeholders are resolved before the value is converted to its target type, so they work for numbers and booleans too, even if you quote them.
The variables themselves can then come from wherever your orchestrator takes them, e.g. from an .env file that is not committed:
- Keep this file out of your repository (e.g. by adding it to your
.gitignore).
Missing variables are fatal
If a referenced variable is not set and you didn't provide a default for it, Kuvasz refuses to start. This is intentional: it's much better to fail fast than to silently run with a half-configured integration.
Keep in mind that environment variables are readable for anyone who has access to your Docker daemon (e.g. via docker inspect). If you'd like your secrets to live on the disk only, take a look at the next option.
Splitting your configuration into multiple files
The official Docker image presets the MICRONAUT_CONFIG_FILES environment variable to /config/kuvasz.yml, which is why that's the path where your configuration file should be mounted by default. However, you can override this variable from the outside with a comma-separated list of files, and Kuvasz will load and merge all of them.
This lets you keep your regular configuration in a file you're happy to commit, and your secrets in a separate one that is provided as a Docker secret:
services:
  kuvasz:
    image: kuvaszmonitoring/kuvasz:latest
    # ...
    environment:
      # ...
      MICRONAUT_CONFIG_FILES: /config/kuvasz.yml,/run/secrets/kuvasz-secrets.yml # (1)!
    volumes:
      - ./kuvasz.yml:/config/kuvasz.yml
    secrets:
      - kuvasz-secrets.yml # (2)!
secrets:
  kuvasz-secrets.yml: # (3)!
    file: ./kuvasz-secrets.yml
- The order matters: if the very same setting is present in more than one file, the last one wins.
- Docker mounts it into the container as
/run/secrets/kuvasz-secrets.yml. - The name of the secret determines the file name inside the container, so it has to end with
.yml(or.yaml), see the note about the extension below.
app-config:
  event-data-retention-days: 365
http-monitors:
  - name: my_website
    url: https://your-domain.com
    uptime-check-interval: 60
    integrations:
      - 'slack:alerts' # (1)!
- Referencing an integration that is defined in the other file works perfectly fine, the two files are merged before anything is validated.
integrations:
  slack:
    - name: alerts
      webhook-url: 'https://hooks.slack.com/services/T00000000/B00000000/XXXXXXXXXXXXXXXX'
  pagerduty:
    - name: oncall
      integration-key: YourOwnIntegrationKey
Tip
Make sure that the file is readable inside the container, otherwise Kuvasz won't start!
This approach isn't tied to Docker secrets at all: any additional file that is readable inside the container works, no matter whether it comes from a plain bind mount, an encrypted volume, a Kubernetes Secret mounted as a file, or a secret manager that renders it to the disk.
Things to keep in mind
- Every file in the list must exist, otherwise Kuvasz won't start (
Failed to read configuration file: ...). The image ships an empty placeholder at/config/kuvasz.yml, so keeping that entry in the list is safe even if you don't mount anything there. - The extension matters: every file must end with
.ymlor.yaml, otherwise the startup fails with anUnsupported properties file formaterror. This is especially important for Docker secrets, where the file name is derived from the name of the secret. - Later files win over the earlier ones for the settings that are present in more than one of them, and the YAML configuration as a whole takes precedence over the environment variables.
- Never split the very same list across multiple files! Lists (e.g.
integrations.slack,http-monitors,status-pages) are merged by their position, so ifintegrations.slackis present in two files, the entries of the last one will overwrite the entries of the first one one by one, and the extra entries of the first file are dropped entirely. A given list should always live in exactly one file, but different lists (even under the same parent key, likeintegrations.slackandintegrations.pagerduty) can be spread across different files without any problem.
Home Assistant RESTful integration
Warning
While the methods described below still work, there is a dedicated integration for Kuvasz, which is the recommended way to integrate your monitors with Home Assistant, as it provides a better user experience, more features, and it's easier to set up and maintain.
Kuvasz can be easily integrated with Home Assistant using the RESTful integration by using its API. This allows you to create sensors for your most precious monitors and use them in your automations, scripts, or just to visualize the status of your monitors. You can even build your own custom dashboard with the data from your monitors!
Tip
If you have the authentication disabled, you can skip setting up your API key as a secret and you can also omit the X-API-KEY header in your requests.
Define your secret in Home Assistant
Sensor with JSON attributes
sensor:
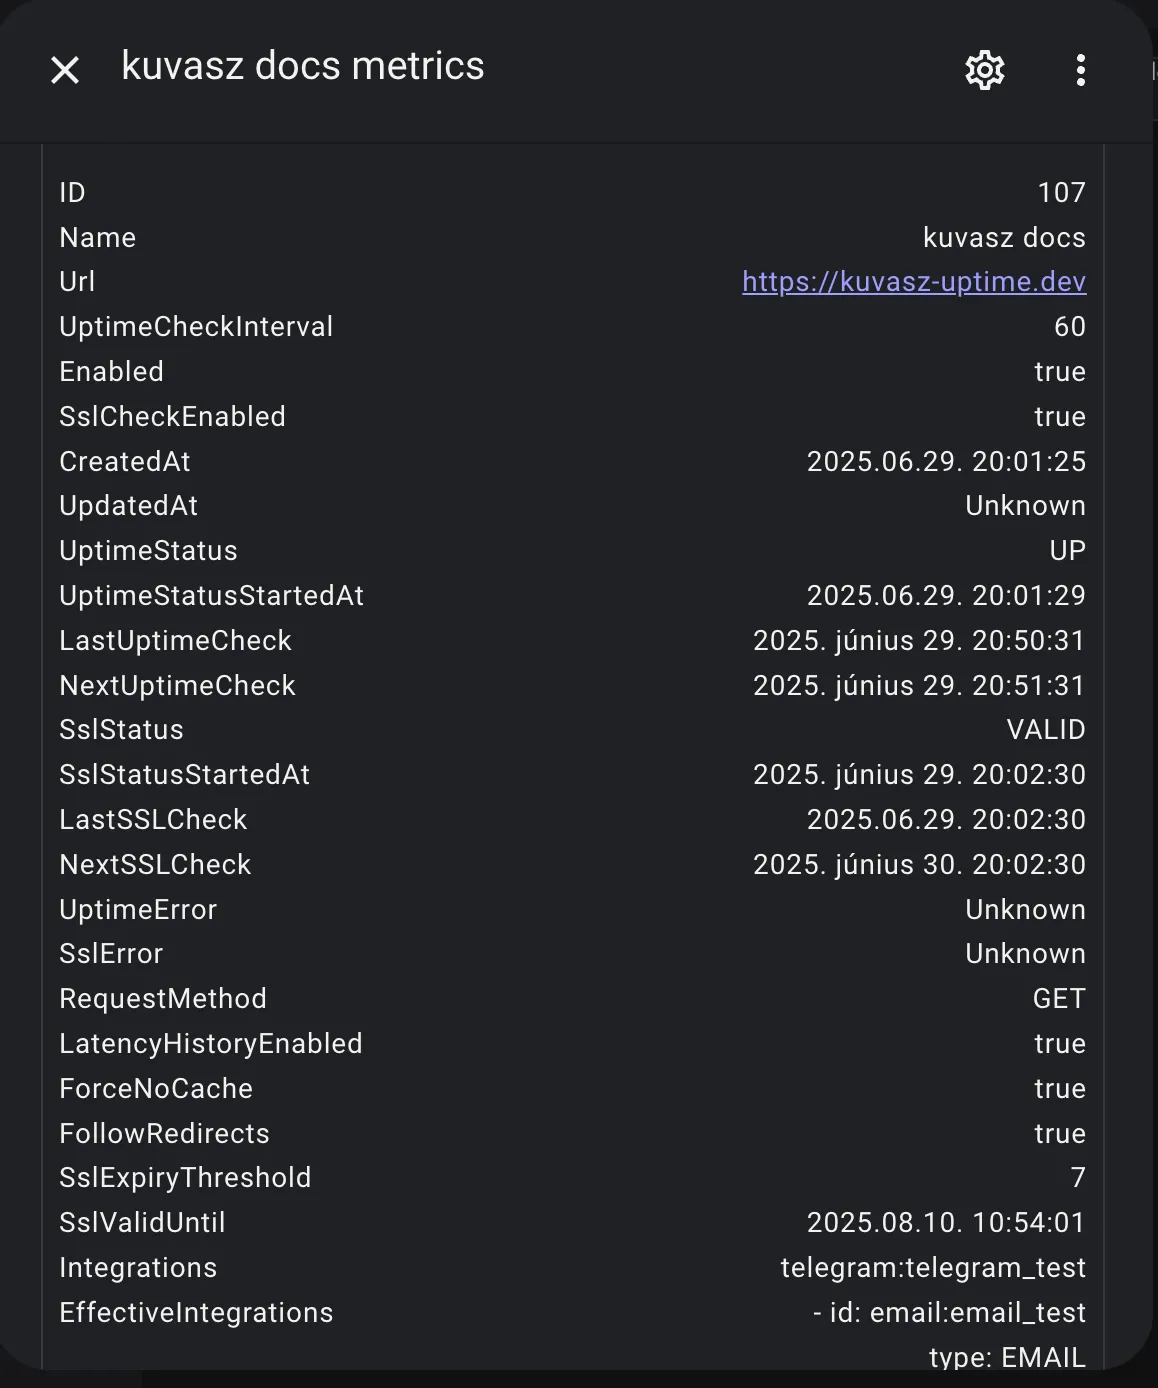
  - name: "kuvasz docs metrics"
    unique_id: metrics_kuvasz_docs
    platform: rest
    verify_ssl: false
    scan_interval: 60
    resource: http://kuvasz.home/api/v2/http-monitors/107
    headers:
      X-API-KEY: !secret kuvasz_api_key
    value_template: "OK"
    json_attributes:
      - id
      - name
      - url
      - uptimeCheckInterval
      - enabled
      - sslCheckEnabled
      - createdAt
      - updatedAt
      - uptimeStatus
      - uptimeStatusStartedAt
      - lastUptimeCheck
      - nextUptimeCheck
      - sslStatus
      - sslStatusStartedAt
      - lastSSLCheck
      - nextSSLCheck
      - uptimeError
      - sslError
      - requestMethod
      - latencyHistoryEnabled
      - forceNoCache
      - followRedirects
      - crossOriginHeaderPropagation
      - sslExpiryThreshold
      - failureCountThreshold
      - sslValidUntil
      - integrations
      - effectiveIntegrations
Result:
Binary sensor for uptime as connectivity
binary_sensor:
  - name: "kuvasz docs uptime status"
    unique_id: uptime_kuvasz_docs
    platform: rest
    verify_ssl: false
    scan_interval: 60
    resource: http://kuvasz.home/api/v2/http-monitors/107
    headers:
      X-API-KEY: !secret kuvasz_api_key
    device_class: connectivity
    value_template: >
      {% set status = value_json.uptimeStatus %}
      {{ status == 'UP' }}
    availability: >
      {{ value_json.uptimeStatus is not none }}
Result:

Exposing status pages on subdomains behind a reverse proxy
If you want to expose your status pages on subdomains (e.g. status.yourdomain.com), you can do so by using a reverse proxy (e.g. Caddy, Nginx, Traefik, etc.). Here is an example configuration for Caddy:
status.your-domain.com {
    reverse_proxy {YOUR_KUVASZ_HOST}:8080
    rewrite /public/* {uri} # (1)!
    rewrite * /status{uri} # (2)!
}
- This is needed to serve the static assets (CSS, JS, images, etc.) correctly.
- This will rewrite all requests to
/status, which is the path where the status pages are served.
The configuration snippet above exposes the default status page (that is located under /status on Kuvasz) on the root of the configured subdomain (i.e. status.your-domain.com), and also proxies the other status pages (e.g. /status/your-custom-status-page) on requesting status.your-domain.com/your-custom-status-page.
Providing a custom root certificate for SSL checks
If you want to use a custom root certificate for SSL checks (e.g. if you're using a self-signed certificate, or a private CA), you can provide it by modifying the Java Keystore (JKS) in use, to add your custom root certificate to it.
The advantage of this approach is, that you only need to do the following steps when:
- you have a new cert, or you would like to update the existing custom one
- we change the base image of the Docker build (should not happen in the near future)
Otherwise you can just use your own "patched" cacerts for every new version of Kuvasz.
Preparing the custom cacerts file
# 1. Pull the current image
docker pull kuvaszmonitoring/kuvasz:latest
# 2. Copy the "original" cacerts to a local file
docker run --rm --entrypoint cat kuvaszmonitoring/kuvasz:latest /opt/java/openjdk/lib/security/cacerts > cacerts
# 3. This is the tricky step: we attach back the current folder where the cacerts, and also the custom certificate should exist and we add the custom certificate to the keystore
docker run --rm -v `pwd`:/tmp/certs kuvaszmonitoring/kuvasz:latest sh -c 'cd /tmp/certs && keytool -keystore cacerts -storepass changeit -noprompt -trustcacerts -importcert -alias your-custom-alias -file your-custom-cert.crt'
Watch out for your-custom-alias and your-custom-cert.crt in the example, these are the moving parts, depending on your own preferences.
Attaching the modified cacerts to Kuvasz
This is easier, and quite straightforward, you just need to mount another volume with your cacerts file from the steps above:
Backup & Restore with YAML
It might be useful to create sometimes a backup from your monitors and status pages in case you didn't configure them via a YAML file, because later you might want to switch to that method, or you just want to make it possible to restore them in case of an accidental deletion, for example.
- To do so, you can use the Web UI (Settings > Backup & Restore) or the API (Monitors, Status pages). The response in both cases will be a YAML file, which you can save to a safe place.
- To restore those files, you can just simply copy the content of them as-is into your own YAML configuration file, and restart your instance of Kuvasz.
- If you would like to continue using the UI or the API to manage your monitors and status pages, you need to remove the corresponding sections from your YAML configuration file after the successful restore and restart your instance once again. After that, you should be able to manage everything via the UI or the API as before.
Homepage integration
Homepage is a really nice open-source tool to create a personal dashboard with links, widgets, and more. You can integrate Kuvasz into your homepage dashboard by using their custom API widget.
The examples below doesn't necessarily map all the possible fields, but it gives you a good starting point to create your own widgets.
Global HTTP stats
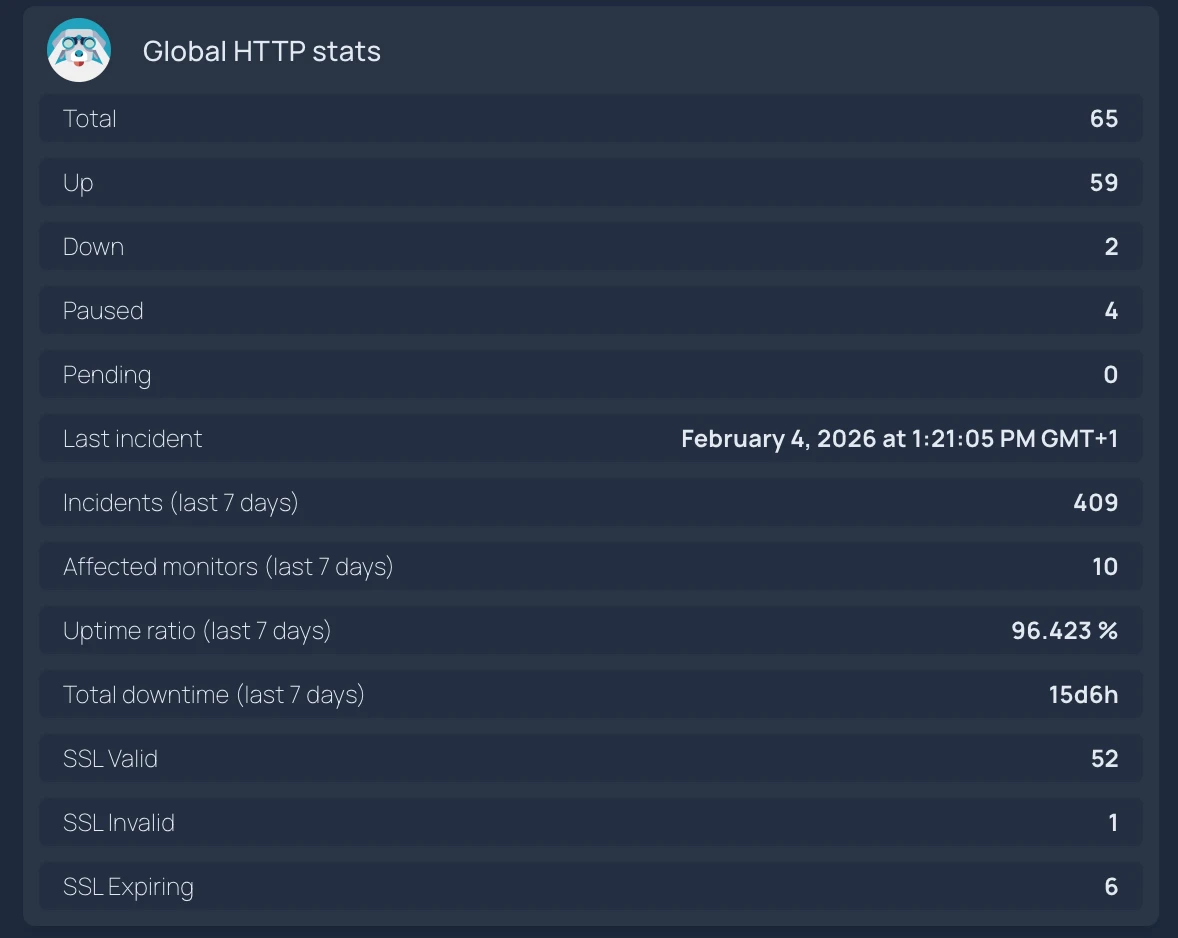
Expand for example configuration
- Global HTTP stats:
    id: kuvasz-http-stats
    icon: sh-kuvasz
    widget:
      type: customapi
      display: list
      url: https://demo.kuvasz-uptime.dev/api/v2/http-monitors/stats
      refreshInterval: 300
      headers:
         X-Api-Key: KuvaszDemoAPIKey
      mappings:
        - label: Total
          field: actual.uptimeStats.total
        - label: Up
          field: actual.uptimeStats.up
        - label: Down
          field: actual.uptimeStats.down
        - label: Paused
          field: actual.uptimeStats.paused
        - label: Pending
          field: actual.uptimeStats.inProgress
        - label: Last incident
          field: actual.uptimeStats.lastIncident
          format: date
          locale: en
          dateStyle: long
          timeStyle: long
        - label: Incidents (last 7 days)
          field: history.uptimeStats.incidents
        - label: Affected monitors (last 7 days)
          field: history.uptimeStats.affectedMonitors
        - label: Uptime ratio (last 7 days)
          field: history.uptimeStats.uptimeRatio
          format: float
          scale: 100
          suffix: '%'
        - label: Total downtime (last 7 days)
          field: history.uptimeStats.totalDowntimeSeconds
          format: duration
        - label: SSL Valid
          field: actual.sslStats.valid
        - label: SSL Invalid
          field: actual.sslStats.invalid
        - label: SSL Expiring
          field: actual.sslStats.willExpire
Individual monitor stats
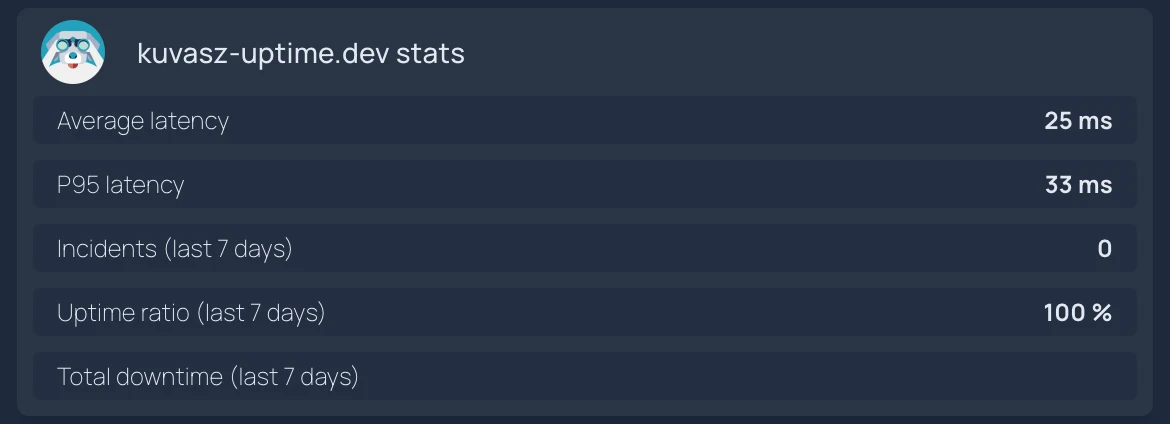
Expand for example configuration
- kuvasz-uptime.dev stats:
    id: kuvasz-uptime-http-stats
    icon: sh-kuvasz
    widget:
      type: customapi
      display: list
      url: https://demo.kuvasz-uptime.dev/api/v2/http-monitors/38/stats
      refreshInterval: 300
      headers:
        X-Api-Key: KuvaszDemoAPIKey
      mappings:
        - label: Average latency
          field: latencyStats.averageLatencyInMs
          format: number
          suffix: ms
        - label: P95 latency
          field: latencyStats.p95LatencyInMs
          format: number
          suffix: ms

        - label: Incidents (last 7 days)
          field: uptimeHistory.incidents
        - label: Uptime ratio (last 7 days)
          field: uptimeHistory.uptimeRatio
          format: float
          scale: 100
          suffix: '%'
        - label: Total downtime (last 7 days)
          field: uptimeHistory.totalDowntimeSeconds
          format: duration
Individual monitor details
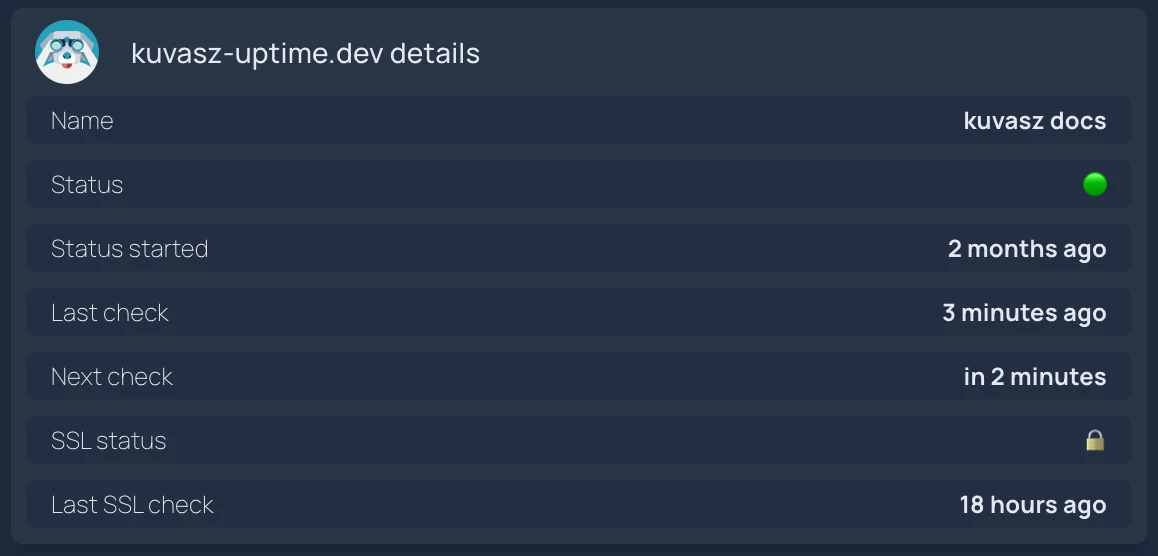
Expand for example configuration
- kuvasz-uptime.dev details:
    id: kuvasz-uptime-http-details
    icon: sh-kuvasz
    widget:
      type: customapi
      display: list
      url: https://demo.kuvasz-uptime.dev/api/v2/http-monitors/38
      refreshInterval: 300
      headers:
        X-Api-Key: KuvaszDemoAPIKey
      mappings:
        - label: Name
          field: name
        - label: Status
          field: uptimeStatus
          remap:
            - value: UP
              to: 🟢
            - value: DOWN
              to: 🔴
            - any: true
              to: 🟡
        - label: Status started
          field: uptimeStatusStartedAt
          format: relativeDate
          locale: en
          style: long
        - label: Last check
          field: lastUptimeCheck
          format: relativeDate
          locale: en
          style: long
        - label: Next check
          field: nextUptimeCheck
          format: relativeDate
          locale: en
          style: long
        - label: SSL status
          field: sslStatus
          remap:
            - value: VALID
              to: 🔒
            - value: INVALID
              to: 🔓
            - value: WILL_EXPIRE
              to: 🕣
            - any: true
              to: 🟡
        - label: Last SSL check
          field: lastSSLCheck
          format: relativeDate
          locale: en
          style: long
Overview with a clickable list of monitors
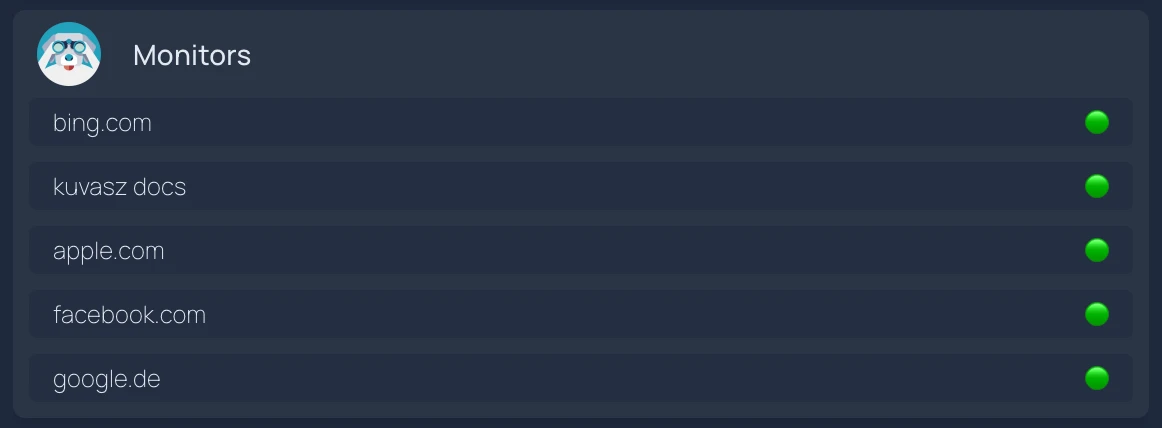
Expand for example configuration
- Monitors:
    id: kuvasz-uptime-http-dynamic-list
    icon: sh-kuvasz
    widget:
      type: customapi
      display: dynamic-list
      url: https://demo.kuvasz-uptime.dev/api/v2/http-monitors?enabled=true
      refreshInterval: 300
      headers:
        X-Api-Key: KuvaszDemoAPIKey
      mappings:
        name: name
        label: uptimeStatus
        limit: 5
        format: text
        remap:
          - value: UP
            to: 🟢
          - value: DOWN
            to: 🔴
          - any: true
            to: 🟡
        target: https://demo.kuvasz-uptime.dev/http-monitors/{id}
Glance custom widgets
Glance is a self-hosted dashboard that lets you put all your feeds, widgets and services on a single page. You can integrate Kuvasz into your Glance dashboard using its custom-api widget.
Tip
If you have the authentication disabled, you can skip the api-key option and the X-Api-Key header in the templates.
Across all the widgets it's better to set your host and API key via environment variables (e.g. KUVASZ_HOST and KUVASZ_API_KEY), so you don't have to repeat them in every widget.
Global stats
This widget can be used for both HTTP and push monitor stats, depending on the configuration. It shows the total count, the up and down monitors, the number of incidents, the affected monitors and the uptime ratio over a given period.
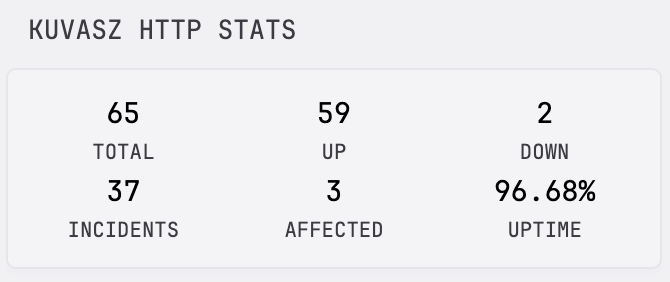
Options
base-url: your Kuvasz host (mandatory)api-key: your API key for Kuvasz (optional if you disabled authentication)monitor-type:http,push,icmp,tcpordns(mandatory)period: an ISO-8601 period string for the cumulative stats (incidents, affected monitors, uptime ratio), e.g.PT24HorP7D. The widget default is 24 hours (PT24H).
Expand for example configuration
- type: custom-api
  title: Kuvasz HTTP stats
  cache: 5m
  options:
    base-url: ${KUVASZ_HOST}
    api-key: ${KUVASZ_API_KEY}
    period: P7D
    monitor-type: http
  template: |
    {{/* Required config options */}}
    {{ $baseURL := .Options.StringOr "base-url" "" }}
    {{ $monitorType := .Options.StringOr "monitor-type" "" }}

    {{/* Optional config options */}}
    {{ $apiKey := .Options.StringOr "api-key" "" }}
    {{ $period := .Options.StringOr "period" "PT24H" }}

    {{ $stats := newRequest (print $baseURL "/api/v2/" $monitorType "-monitors/stats/?period=" $period )
      | withHeader "X-Api-Key" $apiKey
      | getResponse }}
    {{ $uptimeValue := mul 100 ($stats.JSON.Float "history.uptimeStats.uptimeRatio") }}

    <div class="widget-small-content-bounds">
      <div style="display: grid; grid-template-columns: 1fr 1fr 1fr; gap: 10px; text-align: center;">
        <div>
          <p class="size-h3 color-highlight">{{ $stats.JSON.Int "actual.uptimeStats.total" }}</p>
          <p class="size-h6">TOTAL</p>
        </div>
        <div>
          <p class="size-h3 color-highlight">{{ $stats.JSON.Int "actual.uptimeStats.up" }}</p>
          <p class="size-h6">UP</p>
        </div>
        <div>
          <p class="size-h3 color-highlight">{{ $stats.JSON.Int "actual.uptimeStats.down" }}</p>
          <p class="size-h6">DOWN</p>
        </div>
      </div>
      <div style="display: grid; grid-template-columns: 1fr 1fr 1fr; gap: 10px; text-align: center;">
        <div>
          <p class="size-h3 color-highlight">{{ $stats.JSON.Int "history.uptimeStats.incidents" }}</p>
          <p class="size-h6">INCIDENTS</p>
        </div>
        <div>
          <p class="size-h3 color-highlight">{{ $stats.JSON.Int "history.uptimeStats.affectedMonitors" }}</p>
          <p class="size-h6">AFFECTED</p>
        </div>
        <div>
          <p class="size-h3 color-highlight">{{ printf "%.2f" $uptimeValue }}%</p>
          <p class="size-h6">UPTIME</p>
        </div>
      </div>
    </div>
HTTP monitors
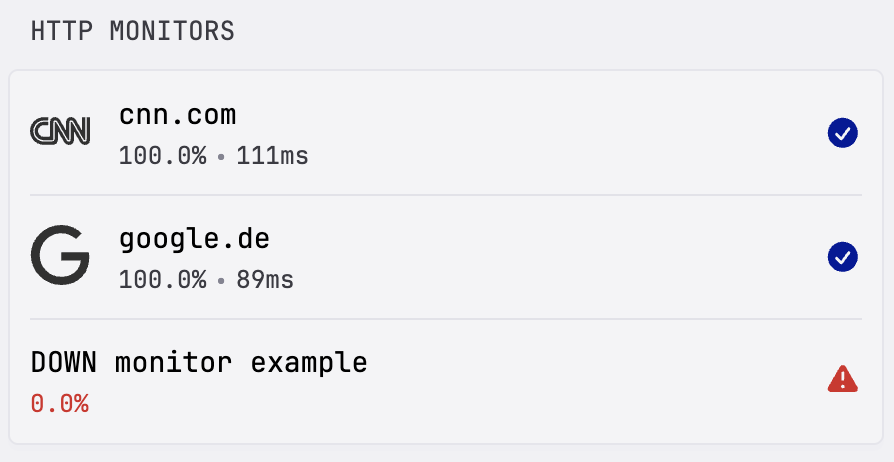
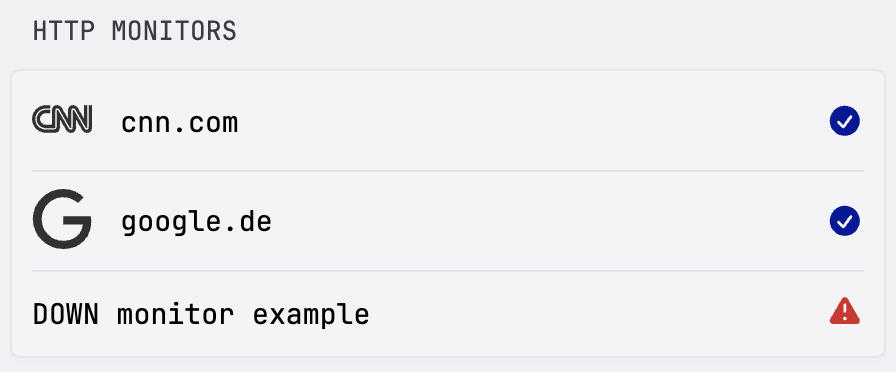
Lists the HTTP monitors from Kuvasz with their uptime ratio, latency metrics (configurable) and state. You can also set up custom icons, URLs, or decide which monitors to show.
Options
base-url: your Kuvasz host (mandatory)api-key: your API key for Kuvasz (optional if you disabled authentication)style: eitherfullorcompact. The full version can have custom icons and displays 2 metrics, while the compact variant only shows 1 metric and doesn't support custom icons. Default isfull.period: an ISO-8601 period string for the cumulative stats, e.g.PT24HorP7D. The widget default is 24 hours (PT24H).show-metrics: whether to load and display metrics at all. Be aware that showing metrics for a lot of monitors could slow down your dashboard, since the metrics need to be fetched on a per-monitor basis.compact-metric: the metric to show in the compact variant, eitheruptimeorlatency, default isuptimelatency-metric: the latency metric to show, one ofaverage,min,max,p90,p95,p99, default isaverageshow-failing-only: iftrue, only the failing (down) monitors will be shownshow-configured-only: iftrue, only the explicitly configured monitors will be shown (see below)
Explicit monitor configs
Under options you can configure your monitors by their name, adding custom icons or overwriting their links (by default the Kuvasz monitor detail page is used as the link). To use a custom icon, use the monitor's name as the property key with any of the following:
- Simple Icons with the
si:prefix - Dashboard icons with
di: - Material Design Icons with
mdi: - Self-hosted icons with
sh: - or a plain, direct URL to an image
'cnn.com': si:cnn # using Simple Icons
'cnn.com-url': https://cnn.com # overwriting the monitor's link on the dashboard
When show-configured-only is true, only the monitors that have a custom icon or a custom URL will be shown.
Expand for example configuration
- type: custom-api
  title: HTTP monitors
  cache: 5m
  options:
    base-url: ${KUVASZ_HOST}
    api-key: ${KUVASZ_API_KEY}
    style: full
    period: P1D
    show-metrics: true
    compact-metric: latency
    latency-metric: p95
    show-failing-only: false
    show-configured-only: true
    'cnn.com': si:cnn
    'cnn.com-url': https://cnn.com
    'google.de': si:google
    'DOWN monitor example-url': https://example.com
  template: |
    {{/* Required config options */}}
    {{ $baseURL := .Options.StringOr "base-url" "" }}

    {{/* Optional config options */}}
    {{ $apiKey := .Options.StringOr "api-key" "" }}
    {{ $period := .Options.StringOr "period" "PT24H" }}
    {{ $style := .Options.StringOr "style" "full" }}
    {{ $showMetrics := .Options.BoolOr "show-metrics" false }}
    {{ $compactMetric := .Options.StringOr "compact-metric" "uptime" }}
    {{ $latencyMetric := .Options.StringOr "latency-metric" "average" }}
    {{ $showFailingOnly := .Options.BoolOr "show-failing-only" false }}
    {{ $showOnlyConfigured := .Options.BoolOr "show-configured-only" false }}

    {{ $monitors := newRequest (print $baseURL "/api/v2/http-monitors?enabled=true")
      | withHeader "X-Api-Key" $apiKey
      | getResponse }}

    {{ $options := .Options }}
    {{ $displayedItems := 0 }}

    {{ if eq $style "compact" }}
      <ul class="dynamic-columns list-gap-8 ">
      {{ range $i, $monitor := $monitors.JSON.Array "" }}
          {{ $name := $monitor.String "name" }}
          {{ $key := $monitor.String "id" }}
          {{ $icon := $options.StringOr $name "" }}
          {{ $linkUrlOption := $options.StringOr (concat $name "-url") "" }}
          {{ $linkUrl := $options.StringOr (concat $name "-url") (concat $baseURL "/http-monitors/" $key) }}
          {{ $status := $monitor.String "uptimeStatus" }}
          {{ $isUp := eq $status "UP" }}
          {{ $isDown := eq $status "DOWN" }}
          {{ $hasLatencyMetrics := false }}

          {{ if and $showFailingOnly (not $isDown) }} {{ continue }} {{ end }}
          {{ if and $showOnlyConfigured (eq $linkUrlOption "") (eq $icon "") }} {{ continue }} {{ end }}
          {{ $displayedItems = add $displayedItems 1 }}

          {{ $metricValue := "" }}
          {{ $stats := "" }}

          {{ if $showMetrics }}
            {{ $stats = newRequest (print $baseURL "/api/v2/http-monitors/" $key "/stats/?period=" $period )
                | withHeader "X-Api-Key" $apiKey
                | getResponse }}
            {{ $hasLatencyMetrics = $stats.JSON.Exists "latencyStats.averageLatencyInMs" }}
          {{ end }}

          <div class="flex items-center gap-12">
            <a class="size-title-dynamic color-highlight text-truncate block grow" href="{{ $linkUrl | safeURL }}" target="_blank" rel="noreferrer">{{ $name }}</a>
            <a href="{{ $linkUrl | safeURL }}" target="_blank" rel="noreferrer">
              {{ if eq $compactMetric "uptime" }}
                {{ $metricValue = mul 100 ($stats.JSON.Float "uptimeHistory.uptimeRatio") }}
                <div>{{ printf "%.2f" $metricValue }}%</div>
              {{ else if $hasLatencyMetrics }}
                <div>{{ $stats.JSON.Int (printf "latencyStats.%sLatencyInMs" $latencyMetric) }}ms</div>
              {{ end }}
            </a>

            {{ if $isUp }}
              <div class="monitor-site-status-icon-compact">
                <a href="{{ $linkUrl | safeURL }}" target="_blank" rel="noreferrer">
                    <svg fill="var(--color-positive)" xmlns="http://www.w3.org/2000/svg" viewBox="0 0 20 20">
                      <path fill-rule="evenodd" d="M10 18a8 8 0 1 0 0-16 8 8 0 0 0 0 16Zm3.857-9.809a.75.75 0 0 0-1.214-.882l-3.483 4.79-1.88-1.88a.75.75 0 1 0-1.06 1.061l2.5 2.5a.75.75 0 0 0 1.137-.089l4-5.5Z" clip-rule="evenodd" />
                    </svg>
                </a>
              </div>
            {{ else if $isDown }}
              <div class="monitor-site-status-icon-compact" title="{{ $monitor.String "uptimeError" }}">
                <a href="{{ $linkUrl | safeURL }}" target="_blank" rel="noreferrer">
                    <svg fill="var(--color-negative)" xmlns="http://www.w3.org/2000/svg" viewBox="0 0 20 20">
                      <path fill-rule="evenodd" d="M8.485 2.495c.673-1.167 2.357-1.167 3.03 0l6.28 10.875c.673 1.167-.17 2.625-1.516 2.625H3.72c-1.347 0-2.189-1.458-1.515-2.625L8.485 2.495ZM10 5a.75.75 0 0 1 .75.75v3.5a.75.75 0 0 1-1.5 0v-3.5A.75.75 0 0 1 10 5Zm0 9a1 1 0 1 0 0-2 1 1 0 0 0 0 2Z" clip-rule="evenodd" />
                    </svg>
                </a>
              </div>
            {{ else }}
              <div class="monitor-site-status-icon-compact" title="Not checked yet">
                <a href="{{ $linkUrl | safeURL }}" target="_blank" rel="noreferrer">
                    <svg fill="var(--color-text-subdue)" xmlns="http://www.w3.org/2000/svg" viewBox="0 0 20 20">
                      <path fill-rule="evenodd" d="M10 18a8 8 0 1 0 0-16 8 8 0 0 0 0 16ZM7 9.25a.75.75 0 0 0 0 1.5h6a.75.75 0 0 0 0-1.5H7Z" clip-rule="evenodd" />
                    </svg>
                </a>
              </div>
            {{ end }}
          </div>
        {{ end }}
      </ul>
    {{ else }}
      <ul class="dynamic-columns list-gap-20 list-with-separator">
      {{ range $i, $monitor := $monitors.JSON.Array "" }}
          {{ $name := $monitor.String "name" }}
          {{ $key := $monitor.String "id" }}
          {{ $icon := $options.StringOr $name "" }}
          {{ $linkUrlOption := $options.StringOr (concat $name "-url") "" }}
          {{ $linkUrl := $options.StringOr (concat $name "-url") (concat $baseURL "/http-monitors/" $key) }}
          {{ $status := $monitor.String "uptimeStatus" }}
          {{ $isUp := eq $status "UP" }}
          {{ $isDown := eq $status "DOWN" }}
          {{ $hasLatencyMetrics := false }}

          {{ if and $showFailingOnly (not $isDown) }} {{ continue }} {{ end }}
          {{ if and $showOnlyConfigured (eq $linkUrlOption "") (eq $icon "") }} {{ continue }} {{ end }}
          {{ $displayedItems = add $displayedItems 1 }}

          {{ $uptimeValue := "" }}
          {{ $stats := "" }}

          {{ if $showMetrics }}
            {{ $stats = newRequest (print $baseURL "/api/v2/http-monitors/" $key "/stats/?period=" $period )
                | withHeader "X-Api-Key" $apiKey
                | getResponse }}
            {{ $hasLatencyMetrics = $stats.JSON.Exists "latencyStats.averageLatencyInMs" }}
            {{ $uptimeValue = mul 100 ($stats.JSON.Float "uptimeHistory.uptimeRatio") }}
          {{ end }}

          {{ $iconUrl := "" }}
          {{ if $icon }}
            {{ $iconPrefix := findMatch "^(si|di|mdi|sh):" $icon }}
            {{ $iconBase := replaceMatches "^(si|di|mdi|sh):" "" $icon }}

            {{ $iconExt := findMatch "\\.[a-z]+$" $iconBase }}
            {{ $iconExt := replaceMatches "\\." "" $iconExt }}
            {{ $iconBase = replaceMatches "\\.[a-z]+$" "" $iconBase }}
            {{ if eq $iconExt "" }} {{ $iconExt = "svg" }} {{ end }}

            {{ if eq $iconPrefix "si:" }}
              {{ $iconUrl = concat "https://cdn.jsdelivr.net/npm/simple-icons@latest/icons/" $iconBase ".svg" }}
            {{ else if eq $iconPrefix "di:" }}
              {{ $iconUrl = concat "https://cdn.jsdelivr.net/gh/homarr-labs/dashboard-icons/" $iconExt "/" $iconBase "." $iconExt }}
            {{ else if eq $iconPrefix "mdi:" }}
              {{ $iconUrl = concat "https://cdn.jsdelivr.net/npm/@mdi/svg@latest/svg/" $iconBase ".svg" }}
            {{ else if eq $iconPrefix "sh:" }}
              {{ $iconUrl = concat "https://cdn.jsdelivr.net/gh/selfhst/icons@main/png/" $iconBase ".png" }}
            {{ else }}
              {{ $iconUrl = $icon }}
            {{ end }}
          {{ end }}

          <div class="monitor-site flex items-center gap-15">
            {{ if $iconUrl }}
              <a href="{{ $linkUrl | safeURL }}" target="_blank" rel="noreferrer">
                <img class="monitor-site-icon" src="{{ $iconUrl | safeURL }}" alt="" loading="lazy">
              </a>
            {{ end }}
            <div class="grow min-width-0">
              <a class="size-h3 color-highlight text-truncate block" href="{{ $linkUrl | safeURL }}" target="_blank" rel="noreferrer">{{ $name }}</a>
              {{ if $showMetrics }}
                <a href="{{ $linkUrl | safeURL }}" target="_blank" rel="noreferrer">
                  <ul class="list-horizontal-text">
                    <li class="{{ if $isDown }}color-negative{{ end }}">{{ printf "%.2f" $uptimeValue }}%</li>
                    {{ if $hasLatencyMetrics }}
                      <li>{{ $stats.JSON.Int (printf "latencyStats.%sLatencyInMs" $latencyMetric) }}ms</li>
                    {{ end }}
                  </ul>
                </a>
              {{ end }}
            </div>

            {{ if $isUp }}
              <div class="monitor-site-status-icon">
                <a href="{{ $linkUrl | safeURL }}" target="_blank" rel="noreferrer">
                  <svg fill="var(--color-positive)" xmlns="http://www.w3.org/2000/svg" viewBox="0 0 20 20">
                    <path fill-rule="evenodd" d="M10 18a8 8 0 1 0 0-16 8 8 0 0 0 0 16Zm3.857-9.809a.75.75 0 0 0-1.214-.882l-3.483 4.79-1.88-1.88a.75.75 0 1 0-1.06 1.061l2.5 2.5a.75.75 0 0 0 1.137-.089l4-5.5Z" clip-rule="evenodd" />
                  </svg>
                </a>
              </div>
            {{ else if $isDown }}
              <div class="monitor-site-status-icon" title="{{ $monitor.String "uptimeError" }}">
                <a href="{{ $linkUrl | safeURL }}" target="_blank" rel="noreferrer">
                  <svg fill="var(--color-negative)" xmlns="http://www.w3.org/2000/svg" viewBox="0 0 20 20">
                    <path fill-rule="evenodd" d="M8.485 2.495c.673-1.167 2.357-1.167 3.03 0l6.28 10.875c.673 1.167-.17 2.625-1.516 2.625H3.72c-1.347 0-2.189-1.458-1.515-2.625L8.485 2.495ZM10 5a.75.75 0 0 1 .75.75v3.5a.75.75 0 0 1-1.5 0v-3.5A.75.75 0 0 1 10 5Zm0 9a1 1 0 1 0 0-2 1 1 0 0 0 0 2Z" clip-rule="evenodd" />
                  </svg>
                </a>
              </div>
            {{ else }}
              <div class="monitor-site-status-icon" title="Not checked yet">
                <a href="{{ $linkUrl | safeURL }}" target="_blank" rel="noreferrer">
                  <svg fill="var(--color-text-subdue)" xmlns="http://www.w3.org/2000/svg" viewBox="0 0 20 20">
                    <path fill-rule="evenodd" d="M10 18a8 8 0 1 0 0-16 8 8 0 0 0 0 16ZM7 9.25a.75.75 0 0 0 0 1.5h6a.75.75 0 0 0 0-1.5H7Z" clip-rule="evenodd" />
                  </svg>
                </a>
              </div>
            {{ end }}

          </div>
        {{ end }}
      </ul>
    {{ end }}

    {{ if eq $displayedItems 0 }}
      <div class="flex items-center justify-center gap-10 padding-block-5">
        <p>All sites are online</p>
        <svg class="shrink-0" style="width: 1.7rem;" xmlns="http://www.w3.org/2000/svg" viewBox="0 0 24 24" fill="var(--color-positive)">
          <path fill-rule="evenodd" d="M2.25 12c0-5.385 4.365-9.75 9.75-9.75s9.75 4.365 9.75 9.75-4.365 9.75-9.75 9.75S2.25 17.385 2.25 12Zm13.36-1.814a.75.75 0 1 0-1.22-.872l-3.236 4.53L9.53 12.22a.75.75 0 0 0-1.06 1.06l2.25 2.25a.75.75 0 0 0 1.14-.094l3.75-5.25Z" clip-rule="evenodd" />
        </svg>
      </div>
    {{ end }}
Push monitors
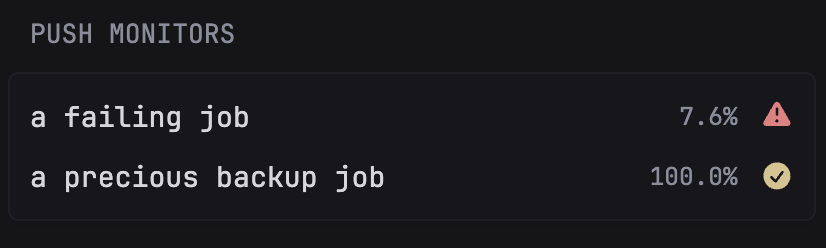
Very similar to the HTTP monitors widget, but latency is not relevant here.
Options
base-url: your Kuvasz host (mandatory)api-key: your API key for Kuvasz (optional if you disabled authentication)period: an ISO-8601 period string for the cumulative stats, e.g.PT24HorP7D. The widget default is 24 hours (PT24H).show-uptime: whether to load and display the uptime ratio. Be aware that showing it for a lot of monitors could slow down your dashboard, since it's fetched on a per-monitor basis.show-failing-only: iftrue, only the failing (down) monitors will be shownshow-configured-only: iftrue, only the explicitly configured monitors will be shown. The explicit monitor config is the same as for the HTTP monitors.
Explicit monitor configs
Under options you can configure your monitors by their name, explicitly enabling them, or overwriting their links (by default the Kuvasz monitor detail page is used as the link).
'a failing job': true # explicitly adding the monitor to the displayed list
'a failing job-url': https://your-own-url.com # overwriting the link for it
When show-configured-only is true, only the monitors that have an explicit configuration entry (either for the visibility or for the URL) will be shown.
Expand for example configuration
- type: custom-api
  title: Push monitors
  cache: 5m
  options:
    base-url: ${KUVASZ_HOST}
    api-key: ${KUVASZ_API_KEY}
    period: P1D
    show-uptime: true
    show-failing-only: false
    show-configured-only: false
    'a failing job': true
    'a failing job-url': https://your-own-url.com
  template: |
    {{/* Required config options */}}
    {{ $baseURL := .Options.StringOr "base-url" "" }}

    {{/* Optional config options */}}
    {{ $apiKey := .Options.StringOr "api-key" "" }}
    {{ $period := .Options.StringOr "period" "PT24H" }}
    {{ $showUptime := .Options.BoolOr "show-uptime" false }}
    {{ $showFailingOnly := .Options.BoolOr "show-failing-only" false }}
    {{ $showOnlyConfigured := .Options.BoolOr "show-configured-only" false }}

    {{ $monitors := newRequest (print $baseURL "/api/v2/push-monitors?enabled=true")
      | withHeader "X-Api-Key" $apiKey
      | getResponse }}

    {{ $options := .Options }}
    {{ $displayedItems := 0 }}

    <ul class="dynamic-columns list-gap-8 ">
    {{ range $i, $monitor := $monitors.JSON.Array "" }}
        {{ $name := $monitor.String "name" }}
        {{ $key := $monitor.String "id" }}
        {{ $isConfigured := $options.BoolOr $name false }}
        {{ $linkUrlOption := $options.StringOr (concat $name "-url") "" }}
        {{ $linkUrl := $options.StringOr (concat $name "-url") (concat $baseURL "/push-monitors/" $key) }}
        {{ $status := $monitor.String "uptimeStatus" }}
        {{ $isUp := eq $status "UP" }}
        {{ $isDown := eq $status "DOWN" }}

        {{ if and $showFailingOnly (not $isDown) }} {{ continue }} {{ end }}
        {{ if and $showOnlyConfigured (eq $linkUrlOption "") (not $isConfigured) }} {{ continue }} {{ end }}
        {{ $displayedItems = add $displayedItems 1 }}

        {{ $stats := "" }}
        {{ $uptimeValue := "" }}

        {{ if $showUptime }}
          {{ $stats = newRequest (print $baseURL "/api/v2/push-monitors/" $key "/stats/?period=" $period )
              | withHeader "X-Api-Key" $apiKey
              | getResponse }}
          {{ $uptimeValue = mul 100 ($stats.JSON.Float "uptimeHistory.uptimeRatio") }}
        {{ end }}

        <div class="flex items-center gap-12">
          <a class="size-title-dynamic color-highlight text-truncate block grow" href="{{ $linkUrl | safeURL }}" target="_blank" rel="noreferrer">{{ $name }}</a>
          {{ if $showUptime }}
            <a href="{{ $linkUrl | safeURL }}" target="_blank" rel="noreferrer">
              <div>{{ printf "%.2f" $uptimeValue }}%</div>
            </a>
          {{ end }}

          {{ if $isUp }}
            <div class="monitor-site-status-icon-compact">
              <a href="{{ $linkUrl | safeURL }}" target="_blank" rel="noreferrer">
                  <svg fill="var(--color-positive)" xmlns="http://www.w3.org/2000/svg" viewBox="0 0 20 20">
                    <path fill-rule="evenodd" d="M10 18a8 8 0 1 0 0-16 8 8 0 0 0 0 16Zm3.857-9.809a.75.75 0 0 0-1.214-.882l-3.483 4.79-1.88-1.88a.75.75 0 1 0-1.06 1.061l2.5 2.5a.75.75 0 0 0 1.137-.089l4-5.5Z" clip-rule="evenodd" />
                  </svg>
              </a>
            </div>
          {{ else if $isDown }}
            <div class="monitor-site-status-icon-compact" title="{{ $monitor.String "uptimeError" }}">
              <a href="{{ $linkUrl | safeURL }}" target="_blank" rel="noreferrer">
                  <svg fill="var(--color-negative)" xmlns="http://www.w3.org/2000/svg" viewBox="0 0 20 20">
                    <path fill-rule="evenodd" d="M8.485 2.495c.673-1.167 2.357-1.167 3.03 0l6.28 10.875c.673 1.167-.17 2.625-1.516 2.625H3.72c-1.347 0-2.189-1.458-1.515-2.625L8.485 2.495ZM10 5a.75.75 0 0 1 .75.75v3.5a.75.75 0 0 1-1.5 0v-3.5A.75.75 0 0 1 10 5Zm0 9a1 1 0 1 0 0-2 1 1 0 0 0 0 2Z" clip-rule="evenodd" />
                  </svg>
              </a>
            </div>
          {{ else }}
            <div class="monitor-site-status-icon-compact" title="Not checked yet">
              <a href="{{ $linkUrl | safeURL }}" target="_blank" rel="noreferrer">
                  <svg fill="var(--color-text-subdue)" xmlns="http://www.w3.org/2000/svg" viewBox="0 0 20 20">
                    <path fill-rule="evenodd" d="M10 18a8 8 0 1 0 0-16 8 8 0 0 0 0 16ZM7 9.25a.75.75 0 0 0 0 1.5h6a.75.75 0 0 0 0-1.5H7Z" clip-rule="evenodd" />
                  </svg>
              </a>
            </div>
          {{ end }}
        </div>
      {{ end }}
    </ul>

    {{ if eq $displayedItems 0 }}
      <div class="flex items-center justify-center gap-10 padding-block-5">
        <p>All sites are online</p>
        <svg class="shrink-0" style="width: 1.7rem;" xmlns="http://www.w3.org/2000/svg" viewBox="0 0 24 24" fill="var(--color-positive)">
          <path fill-rule="evenodd" d="M2.25 12c0-5.385 4.365-9.75 9.75-9.75s9.75 4.365 9.75 9.75-4.365 9.75-9.75 9.75S2.25 17.385 2.25 12Zm13.36-1.814a.75.75 0 1 0-1.22-.872l-3.236 4.53L9.53 12.22a.75.75 0 0 0-1.06 1.06l2.25 2.25a.75.75 0 0 0 1.14-.094l3.75-5.25Z" clip-rule="evenodd" />
        </svg>
      </div>
    {{ end }}
ICMP monitors
Lists the ping (ICMP) monitors from Kuvasz with their host, uptime ratio, latency and packet loss metrics (all configurable) and state. Just like the HTTP widget, it supports custom icons, custom links and filtering. Packet loss and latency metrics are only available when metrics history is enabled on the given monitor.
Options
base-url: your Kuvasz host (mandatory)api-key: your API key for Kuvasz (optional if you disabled authentication)period: an ISO-8601 period string for the cumulative stats, e.g.PT24HorP7D. The widget default is 24 hours (PT24H).show-metrics: whether to load and display metrics at all. Be aware that showing metrics for a lot of monitors could slow down your dashboard, since the metrics need to be fetched on a per-monitor basis.latency-metric: the latency metric to show, one ofaverage,min,max,p90,p95,p99, default isaveragepacket-loss-metric: the packet loss metric to show, one ofaverage,min,max,p90,p95,p99, default isaverageshow-packet-loss: whether to display the packet loss metric next to the latency, default isfalseshow-failing-only: iftrue, only the failing (down) monitors will be shownshow-configured-only: iftrue, only the explicitly configured monitors will be shown. The explicit monitor config is the same as for the HTTP monitors.
Expand for example configuration
- type: custom-api
  title: ICMP monitors
  cache: 5m
  options:
    base-url: ${KUVASZ_HOST}
    api-key: ${KUVASZ_API_KEY}
    period: P1D
    show-metrics: true
    latency-metric: average
    packet-loss-metric: max
    show-packet-loss: true
    show-failing-only: false
    show-configured-only: false
    'Local router': mdi:router-network
    'Local router-url': http://192.168.1.1
  template: |
    {{/* Required config options */}}
    {{ $baseURL := .Options.StringOr "base-url" "" }}

    {{/* Optional config options */}}
    {{ $apiKey := .Options.StringOr "api-key" "" }}
    {{ $period := .Options.StringOr "period" "PT24H" }}
    {{ $showMetrics := .Options.BoolOr "show-metrics" false }}
    {{ $latencyMetric := .Options.StringOr "latency-metric" "average" }}
    {{ $packetLossMetric := .Options.StringOr "packet-loss-metric" "average" }}
    {{ $showPacketLoss := .Options.BoolOr "show-packet-loss" false }}
    {{ $showFailingOnly := .Options.BoolOr "show-failing-only" false }}
    {{ $showOnlyConfigured := .Options.BoolOr "show-configured-only" false }}

    {{ $monitors := newRequest (print $baseURL "/api/v2/icmp-monitors?enabled=true")
      | withHeader "X-Api-Key" $apiKey
      | getResponse }}

    {{ $options := .Options }}
    {{ $displayedItems := 0 }}

    <ul class="dynamic-columns list-gap-20 list-with-separator">
    {{ range $i, $monitor := $monitors.JSON.Array "" }}
        {{ $name := $monitor.String "name" }}
        {{ $key := $monitor.String "id" }}
        {{ $host := $monitor.String "host" }}
        {{ $icon := $options.StringOr $name "" }}
        {{ $linkUrlOption := $options.StringOr (concat $name "-url") "" }}
        {{ $linkUrl := $options.StringOr (concat $name "-url") (concat $baseURL "/icmp-monitors/" $key) }}
        {{ $status := $monitor.String "uptimeStatus" }}
        {{ $isUp := eq $status "UP" }}
        {{ $isDown := eq $status "DOWN" }}
        {{ $hasLatency := false }}
        {{ $hasPacketLoss := false }}

        {{ if and $showFailingOnly (not $isDown) }} {{ continue }} {{ end }}
        {{ if and $showOnlyConfigured (eq $linkUrlOption "") (eq $icon "") }} {{ continue }} {{ end }}
        {{ $displayedItems = add $displayedItems 1 }}

        {{ $uptimeValue := "" }}
        {{ $stats := "" }}

        {{ if $showMetrics }}
          {{ $stats = newRequest (print $baseURL "/api/v2/icmp-monitors/" $key "/stats/?period=" $period )
              | withHeader "X-Api-Key" $apiKey
              | getResponse }}
          {{ $hasLatency = $stats.JSON.Exists "latencyStats.averageLatencyInMs" }}
          {{ $hasPacketLoss = $stats.JSON.Exists "packetLossStats.averagePacketLossPercentage" }}
          {{ $uptimeValue = mul 100 ($stats.JSON.Float "uptimeHistory.uptimeRatio") }}
        {{ end }}

        {{ $iconUrl := "" }}
        {{ if $icon }}
          {{ $iconPrefix := findMatch "^(si|di|mdi|sh):" $icon }}
          {{ $iconBase := replaceMatches "^(si|di|mdi|sh):" "" $icon }}

          {{ $iconExt := findMatch "\\.[a-z]+$" $iconBase }}
          {{ $iconExt := replaceMatches "\\." "" $iconExt }}
          {{ $iconBase = replaceMatches "\\.[a-z]+$" "" $iconBase }}
          {{ if eq $iconExt "" }} {{ $iconExt = "svg" }} {{ end }}

          {{ if eq $iconPrefix "si:" }}
            {{ $iconUrl = concat "https://cdn.jsdelivr.net/npm/simple-icons@latest/icons/" $iconBase ".svg" }}
          {{ else if eq $iconPrefix "di:" }}
            {{ $iconUrl = concat "https://cdn.jsdelivr.net/gh/homarr-labs/dashboard-icons/" $iconExt "/" $iconBase "." $iconExt }}
          {{ else if eq $iconPrefix "mdi:" }}
            {{ $iconUrl = concat "https://cdn.jsdelivr.net/npm/@mdi/svg@latest/svg/" $iconBase ".svg" }}
          {{ else if eq $iconPrefix "sh:" }}
            {{ $iconUrl = concat "https://cdn.jsdelivr.net/gh/selfhst/icons@main/png/" $iconBase ".png" }}
          {{ else }}
            {{ $iconUrl = $icon }}
          {{ end }}
        {{ end }}

        <div class="monitor-site flex items-center gap-15">
          {{ if $iconUrl }}
            <a href="{{ $linkUrl | safeURL }}" target="_blank" rel="noreferrer">
              <img class="monitor-site-icon" src="{{ $iconUrl | safeURL }}" alt="" loading="lazy">
            </a>
          {{ end }}
          <div class="grow min-width-0">
            <a class="size-h3 color-highlight text-truncate block" href="{{ $linkUrl | safeURL }}" target="_blank" rel="noreferrer">{{ $name }}</a>
            <ul class="list-horizontal-text">
              <li class="color-subdue">{{ $host }}</li>
              {{ if $showMetrics }}
                <li class="{{ if $isDown }}color-negative{{ end }}">{{ printf "%.2f" $uptimeValue }}%</li>
                {{ if $hasLatency }}
                  <li>{{ $stats.JSON.Int (printf "latencyStats.%sLatencyInMs" $latencyMetric) }}ms</li>
                {{ end }}
                {{ if and $showPacketLoss $hasPacketLoss }}
                  <li>{{ $stats.JSON.Int (printf "packetLossStats.%sPacketLossPercentage" $packetLossMetric) }}% loss</li>
                {{ end }}
              {{ end }}
            </ul>
          </div>

          {{ if $isUp }}
            <div class="monitor-site-status-icon">
              <a href="{{ $linkUrl | safeURL }}" target="_blank" rel="noreferrer">
                <svg fill="var(--color-positive)" xmlns="http://www.w3.org/2000/svg" viewBox="0 0 20 20">
                  <path fill-rule="evenodd" d="M10 18a8 8 0 1 0 0-16 8 8 0 0 0 0 16Zm3.857-9.809a.75.75 0 0 0-1.214-.882l-3.483 4.79-1.88-1.88a.75.75 0 1 0-1.06 1.061l2.5 2.5a.75.75 0 0 0 1.137-.089l4-5.5Z" clip-rule="evenodd" />
                </svg>
              </a>
            </div>
          {{ else if $isDown }}
            <div class="monitor-site-status-icon" title="{{ $monitor.String "uptimeError" }}">
              <a href="{{ $linkUrl | safeURL }}" target="_blank" rel="noreferrer">
                <svg fill="var(--color-negative)" xmlns="http://www.w3.org/2000/svg" viewBox="0 0 20 20">
                  <path fill-rule="evenodd" d="M8.485 2.495c.673-1.167 2.357-1.167 3.03 0l6.28 10.875c.673 1.167-.17 2.625-1.516 2.625H3.72c-1.347 0-2.189-1.458-1.515-2.625L8.485 2.495ZM10 5a.75.75 0 0 1 .75.75v3.5a.75.75 0 0 1-1.5 0v-3.5A.75.75 0 0 1 10 5Zm0 9a1 1 0 1 0 0-2 1 1 0 0 0 0 2Z" clip-rule="evenodd" />
                </svg>
              </a>
            </div>
          {{ else }}
            <div class="monitor-site-status-icon" title="Not checked yet">
              <a href="{{ $linkUrl | safeURL }}" target="_blank" rel="noreferrer">
                <svg fill="var(--color-text-subdue)" xmlns="http://www.w3.org/2000/svg" viewBox="0 0 20 20">
                  <path fill-rule="evenodd" d="M10 18a8 8 0 1 0 0-16 8 8 0 0 0 0 16ZM7 9.25a.75.75 0 0 0 0 1.5h6a.75.75 0 0 0 0-1.5H7Z" clip-rule="evenodd" />
                </svg>
              </a>
            </div>
          {{ end }}

        </div>
      {{ end }}
    </ul>

    {{ if eq $displayedItems 0 }}
      <div class="flex items-center justify-center gap-10 padding-block-5">
        <p>All sites are online</p>
        <svg class="shrink-0" style="width: 1.7rem;" xmlns="http://www.w3.org/2000/svg" viewBox="0 0 24 24" fill="var(--color-positive)">
          <path fill-rule="evenodd" d="M2.25 12c0-5.385 4.365-9.75 9.75-9.75s9.75 4.365 9.75 9.75-4.365 9.75-9.75 9.75S2.25 17.385 2.25 12Zm13.36-1.814a.75.75 0 1 0-1.22-.872l-3.236 4.53L9.53 12.22a.75.75 0 0 0-1.06 1.06l2.25 2.25a.75.75 0 0 0 1.14-.094l3.75-5.25Z" clip-rule="evenodd" />
        </svg>
      </div>
    {{ end }}
TCP monitors
Lists the TCP (port) monitors from Kuvasz with their host:port, uptime ratio, connect latency metric (configurable) and state. Just like the HTTP widget, it supports custom icons, custom links and filtering. The latency metric is only available when metrics history is enabled on the given monitor.
Options
base-url: your Kuvasz host (mandatory)api-key: your API key for Kuvasz (optional if you disabled authentication)period: an ISO-8601 period string for the cumulative stats, e.g.PT24HorP7D. The widget default is 24 hours (PT24H).show-metrics: whether to load and display metrics at all. Be aware that showing metrics for a lot of monitors could slow down your dashboard, since the metrics need to be fetched on a per-monitor basis.latency-metric: the latency metric to show, one ofaverage,min,max,p90,p95,p99, default isaverageshow-failing-only: iftrue, only the failing (down) monitors will be shownshow-configured-only: iftrue, only the explicitly configured monitors will be shown. The explicit monitor config is the same as for the HTTP monitors.
Expand for example configuration
- type: custom-api
  title: TCP monitors
  cache: 5m
  options:
    base-url: ${KUVASZ_HOST}
    api-key: ${KUVASZ_API_KEY}
    period: P1D
    show-metrics: true
    latency-metric: average
    show-failing-only: false
    show-configured-only: false
    'SMTP server': mdi:email-outline
    'SMTP server-url': http://192.168.1.10
  template: |
    {{/* Required config options */}}
    {{ $baseURL := .Options.StringOr "base-url" "" }}

    {{/* Optional config options */}}
    {{ $apiKey := .Options.StringOr "api-key" "" }}
    {{ $period := .Options.StringOr "period" "PT24H" }}
    {{ $showMetrics := .Options.BoolOr "show-metrics" false }}
    {{ $latencyMetric := .Options.StringOr "latency-metric" "average" }}
    {{ $showFailingOnly := .Options.BoolOr "show-failing-only" false }}
    {{ $showOnlyConfigured := .Options.BoolOr "show-configured-only" false }}

    {{ $monitors := newRequest (print $baseURL "/api/v2/tcp-monitors?enabled=true")
      | withHeader "X-Api-Key" $apiKey
      | getResponse }}

    {{ $options := .Options }}
    {{ $displayedItems := 0 }}

    <ul class="dynamic-columns list-gap-20 list-with-separator">
    {{ range $i, $monitor := $monitors.JSON.Array "" }}
        {{ $name := $monitor.String "name" }}
        {{ $key := $monitor.String "id" }}
        {{ $host := $monitor.String "host" }}
        {{ $port := $monitor.String "port" }}
        {{ $target := concat $host ":" $port }}
        {{ $icon := $options.StringOr $name "" }}
        {{ $linkUrlOption := $options.StringOr (concat $name "-url") "" }}
        {{ $linkUrl := $options.StringOr (concat $name "-url") (concat $baseURL "/tcp-monitors/" $key) }}
        {{ $status := $monitor.String "uptimeStatus" }}
        {{ $isUp := eq $status "UP" }}
        {{ $isDown := eq $status "DOWN" }}
        {{ $hasLatency := false }}

        {{ if and $showFailingOnly (not $isDown) }} {{ continue }} {{ end }}
        {{ if and $showOnlyConfigured (eq $linkUrlOption "") (eq $icon "") }} {{ continue }} {{ end }}
        {{ $displayedItems = add $displayedItems 1 }}

        {{ $uptimeValue := "" }}
        {{ $stats := "" }}

        {{ if $showMetrics }}
          {{ $stats = newRequest (print $baseURL "/api/v2/tcp-monitors/" $key "/stats/?period=" $period )
              | withHeader "X-Api-Key" $apiKey
              | getResponse }}
          {{ $hasLatency = $stats.JSON.Exists "latencyStats.averageLatencyInMs" }}
          {{ $uptimeValue = mul 100 ($stats.JSON.Float "uptimeHistory.uptimeRatio") }}
        {{ end }}

        {{ $iconUrl := "" }}
        {{ if $icon }}
          {{ $iconPrefix := findMatch "^(si|di|mdi|sh):" $icon }}
          {{ $iconBase := replaceMatches "^(si|di|mdi|sh):" "" $icon }}

          {{ $iconExt := findMatch "\\.[a-z]+$" $iconBase }}
          {{ $iconExt := replaceMatches "\\." "" $iconExt }}
          {{ $iconBase = replaceMatches "\\.[a-z]+$" "" $iconBase }}
          {{ if eq $iconExt "" }} {{ $iconExt = "svg" }} {{ end }}

          {{ if eq $iconPrefix "si:" }}
            {{ $iconUrl = concat "https://cdn.jsdelivr.net/npm/simple-icons@latest/icons/" $iconBase ".svg" }}
          {{ else if eq $iconPrefix "di:" }}
            {{ $iconUrl = concat "https://cdn.jsdelivr.net/gh/homarr-labs/dashboard-icons/" $iconExt "/" $iconBase "." $iconExt }}
          {{ else if eq $iconPrefix "mdi:" }}
            {{ $iconUrl = concat "https://cdn.jsdelivr.net/npm/@mdi/svg@latest/svg/" $iconBase ".svg" }}
          {{ else if eq $iconPrefix "sh:" }}
            {{ $iconUrl = concat "https://cdn.jsdelivr.net/gh/selfhst/icons@main/png/" $iconBase ".png" }}
          {{ else }}
            {{ $iconUrl = $icon }}
          {{ end }}
        {{ end }}

        <div class="monitor-site flex items-center gap-15">
          {{ if $iconUrl }}
            <a href="{{ $linkUrl | safeURL }}" target="_blank" rel="noreferrer">
              <img class="monitor-site-icon" src="{{ $iconUrl | safeURL }}" alt="" loading="lazy">
            </a>
          {{ end }}
          <div class="grow min-width-0">
            <a class="size-h3 color-highlight text-truncate block" href="{{ $linkUrl | safeURL }}" target="_blank" rel="noreferrer">{{ $name }}</a>
            <ul class="list-horizontal-text">
              <li class="color-subdue">{{ $target }}</li>
              {{ if $showMetrics }}
                <li class="{{ if $isDown }}color-negative{{ end }}">{{ printf "%.2f" $uptimeValue }}%</li>
                {{ if $hasLatency }}
                  <li>{{ $stats.JSON.Int (printf "latencyStats.%sLatencyInMs" $latencyMetric) }}ms</li>
                {{ end }}
              {{ end }}
            </ul>
          </div>

          {{ if $isUp }}
            <div class="monitor-site-status-icon">
              <a href="{{ $linkUrl | safeURL }}" target="_blank" rel="noreferrer">
                <svg fill="var(--color-positive)" xmlns="http://www.w3.org/2000/svg" viewBox="0 0 20 20">
                  <path fill-rule="evenodd" d="M10 18a8 8 0 1 0 0-16 8 8 0 0 0 0 16Zm3.857-9.809a.75.75 0 0 0-1.214-.882l-3.483 4.79-1.88-1.88a.75.75 0 1 0-1.06 1.061l2.5 2.5a.75.75 0 0 0 1.137-.089l4-5.5Z" clip-rule="evenodd" />
                </svg>
              </a>
            </div>
          {{ else if $isDown }}
            <div class="monitor-site-status-icon" title="{{ $monitor.String "uptimeError" }}">
              <a href="{{ $linkUrl | safeURL }}" target="_blank" rel="noreferrer">
                <svg fill="var(--color-negative)" xmlns="http://www.w3.org/2000/svg" viewBox="0 0 20 20">
                  <path fill-rule="evenodd" d="M8.485 2.495c.673-1.167 2.357-1.167 3.03 0l6.28 10.875c.673 1.167-.17 2.625-1.516 2.625H3.72c-1.347 0-2.189-1.458-1.515-2.625L8.485 2.495ZM10 5a.75.75 0 0 1 .75.75v3.5a.75.75 0 0 1-1.5 0v-3.5A.75.75 0 0 1 10 5Zm0 9a1 1 0 1 0 0-2 1 1 0 0 0 0 2Z" clip-rule="evenodd" />
                </svg>
              </a>
            </div>
          {{ else }}
            <div class="monitor-site-status-icon" title="Not checked yet">
              <a href="{{ $linkUrl | safeURL }}" target="_blank" rel="noreferrer">
                <svg fill="var(--color-text-subdue)" xmlns="http://www.w3.org/2000/svg" viewBox="0 0 20 20">
                  <path fill-rule="evenodd" d="M10 18a8 8 0 1 0 0-16 8 8 0 0 0 0 16ZM7 9.25a.75.75 0 0 0 0 1.5h6a.75.75 0 0 0 0-1.5H7Z" clip-rule="evenodd" />
                </svg>
              </a>
            </div>
          {{ end }}

        </div>
      {{ end }}
    </ul>

    {{ if eq $displayedItems 0 }}
      <div class="flex items-center justify-center gap-10 padding-block-5">
        <p>All sites are online</p>
        <svg class="shrink-0" style="width: 1.7rem;" xmlns="http://www.w3.org/2000/svg" viewBox="0 0 24 24" fill="var(--color-positive)">
          <path fill-rule="evenodd" d="M2.25 12c0-5.385 4.365-9.75 9.75-9.75s9.75 4.365 9.75 9.75-4.365 9.75-9.75 9.75S2.25 17.385 2.25 12Zm13.36-1.814a.75.75 0 1 0-1.22-.872l-3.236 4.53L9.53 12.22a.75.75 0 0 0-1.06 1.06l2.25 2.25a.75.75 0 0 0 1.14-.094l3.75-5.25Z" clip-rule="evenodd" />
        </svg>
      </div>
    {{ end }}
DNS monitors
Lists the DNS monitors from Kuvasz with their queried name, uptime ratio, resolution latency metric (configurable) and state. Just like the HTTP widget, it supports custom icons, custom links and filtering. The latency metric is only available when metrics history is enabled on the given monitor.
Options
base-url: your Kuvasz host (mandatory)api-key: your API key for Kuvasz (optional if you disabled authentication)period: an ISO-8601 period string for the cumulative stats, e.g.PT24HorP7D. The widget default is 24 hours (PT24H).show-metrics: whether to load and display metrics at all. Be aware that showing metrics for a lot of monitors could slow down your dashboard, since the metrics need to be fetched on a per-monitor basis.latency-metric: the latency metric to show, one ofaverage,min,max,p90,p95,p99, default isaverageshow-failing-only: iftrue, only the failing (down) monitors will be shownshow-configured-only: iftrue, only the explicitly configured monitors will be shown. The explicit monitor config is the same as for the HTTP monitors.
Expand for example configuration
- type: custom-api
  title: DNS monitors
  cache: 5m
  options:
    base-url: ${KUVASZ_HOST}
    api-key: ${KUVASZ_API_KEY}
    period: P1D
    show-metrics: true
    latency-metric: average
    show-failing-only: false
    show-configured-only: false
    'My DNS Monitor': mdi:dns-outline
    'My DNS Monitor-url': https://example.com
  template: |
    {{/* Required config options */}}
    {{ $baseURL := .Options.StringOr "base-url" "" }}

    {{/* Optional config options */}}
    {{ $apiKey := .Options.StringOr "api-key" "" }}
    {{ $period := .Options.StringOr "period" "PT24H" }}
    {{ $showMetrics := .Options.BoolOr "show-metrics" false }}
    {{ $latencyMetric := .Options.StringOr "latency-metric" "average" }}
    {{ $showFailingOnly := .Options.BoolOr "show-failing-only" false }}
    {{ $showOnlyConfigured := .Options.BoolOr "show-configured-only" false }}

    {{ $monitors := newRequest (print $baseURL "/api/v2/dns-monitors?enabled=true")
      | withHeader "X-Api-Key" $apiKey
      | getResponse }}

    {{ $options := .Options }}
    {{ $displayedItems := 0 }}

    <ul class="dynamic-columns list-gap-20 list-with-separator">
    {{ range $i, $monitor := $monitors.JSON.Array "" }}
        {{ $name := $monitor.String "name" }}
        {{ $key := $monitor.String "id" }}
        {{ $target := $monitor.String "host" }}
        {{ $icon := $options.StringOr $name "" }}
        {{ $linkUrlOption := $options.StringOr (concat $name "-url") "" }}
        {{ $linkUrl := $options.StringOr (concat $name "-url") (concat $baseURL "/dns-monitors/" $key) }}
        {{ $status := $monitor.String "uptimeStatus" }}
        {{ $isUp := eq $status "UP" }}
        {{ $isDown := eq $status "DOWN" }}
        {{ $hasLatency := false }}

        {{ if and $showFailingOnly (not $isDown) }} {{ continue }} {{ end }}
        {{ if and $showOnlyConfigured (eq $linkUrlOption "") (eq $icon "") }} {{ continue }} {{ end }}
        {{ $displayedItems = add $displayedItems 1 }}

        {{ $uptimeValue := "" }}
        {{ $stats := "" }}

        {{ if $showMetrics }}
          {{ $stats = newRequest (print $baseURL "/api/v2/dns-monitors/" $key "/stats/?period=" $period )
              | withHeader "X-Api-Key" $apiKey
              | getResponse }}
          {{ $hasLatency = $stats.JSON.Exists "latencyStats.averageLatencyInMs" }}
          {{ $uptimeValue = mul 100 ($stats.JSON.Float "uptimeHistory.uptimeRatio") }}
        {{ end }}

        {{ $iconUrl := "" }}
        {{ if $icon }}
          {{ $iconPrefix := findMatch "^(si|di|mdi|sh):" $icon }}
          {{ $iconBase := replaceMatches "^(si|di|mdi|sh):" "" $icon }}

          {{ $iconExt := findMatch "\\.[a-z]+$" $iconBase }}
          {{ $iconExt := replaceMatches "\\." "" $iconExt }}
          {{ $iconBase = replaceMatches "\\.[a-z]+$" "" $iconBase }}
          {{ if eq $iconExt "" }} {{ $iconExt = "svg" }} {{ end }}

          {{ if eq $iconPrefix "si:" }}
            {{ $iconUrl = concat "https://cdn.jsdelivr.net/npm/simple-icons@latest/icons/" $iconBase ".svg" }}
          {{ else if eq $iconPrefix "di:" }}
            {{ $iconUrl = concat "https://cdn.jsdelivr.net/gh/homarr-labs/dashboard-icons/" $iconExt "/" $iconBase "." $iconExt }}
          {{ else if eq $iconPrefix "mdi:" }}
            {{ $iconUrl = concat "https://cdn.jsdelivr.net/npm/@mdi/svg@latest/svg/" $iconBase ".svg" }}
          {{ else if eq $iconPrefix "sh:" }}
            {{ $iconUrl = concat "https://cdn.jsdelivr.net/gh/selfhst/icons@main/png/" $iconBase ".png" }}
          {{ else }}
            {{ $iconUrl = $icon }}
          {{ end }}
        {{ end }}

        <div class="monitor-site flex items-center gap-15">
          {{ if $iconUrl }}
            <a href="{{ $linkUrl | safeURL }}" target="_blank" rel="noreferrer">
              <img class="monitor-site-icon" src="{{ $iconUrl | safeURL }}" alt="" loading="lazy">
            </a>
          {{ end }}
          <div class="grow min-width-0">
            <a class="size-h3 color-highlight text-truncate block" href="{{ $linkUrl | safeURL }}" target="_blank" rel="noreferrer">{{ $name }}</a>
            <ul class="list-horizontal-text">
              <li class="color-subdue">{{ $target }}</li>
              {{ if $showMetrics }}
                <li class="{{ if $isDown }}color-negative{{ end }}">{{ printf "%.2f" $uptimeValue }}%</li>
                {{ if $hasLatency }}
                  <li>{{ $stats.JSON.Int (printf "latencyStats.%sLatencyInMs" $latencyMetric) }}ms</li>
                {{ end }}
              {{ end }}
            </ul>
          </div>

          {{ if $isUp }}
            <div class="monitor-site-status-icon">
              <a href="{{ $linkUrl | safeURL }}" target="_blank" rel="noreferrer">
                <svg fill="var(--color-positive)" xmlns="http://www.w3.org/2000/svg" viewBox="0 0 20 20">
                  <path fill-rule="evenodd" d="M10 18a8 8 0 1 0 0-16 8 8 0 0 0 0 16Zm3.857-9.809a.75.75 0 0 0-1.214-.882l-3.483 4.79-1.88-1.88a.75.75 0 1 0-1.06 1.061l2.5 2.5a.75.75 0 0 0 1.137-.089l4-5.5Z" clip-rule="evenodd" />
                </svg>
              </a>
            </div>
          {{ else if $isDown }}
            <div class="monitor-site-status-icon" title="{{ $monitor.String "uptimeError" }}">
              <a href="{{ $linkUrl | safeURL }}" target="_blank" rel="noreferrer">
                <svg fill="var(--color-negative)" xmlns="http://www.w3.org/2000/svg" viewBox="0 0 20 20">
                  <path fill-rule="evenodd" d="M8.485 2.495c.673-1.167 2.357-1.167 3.03 0l6.28 10.875c.673 1.167-.17 2.625-1.516 2.625H3.72c-1.347 0-2.189-1.458-1.515-2.625L8.485 2.495ZM10 5a.75.75 0 0 1 .75.75v3.5a.75.75 0 0 1-1.5 0v-3.5A.75.75 0 0 1 10 5Zm0 9a1 1 0 1 0 0-2 1 1 0 0 0 0 2Z" clip-rule="evenodd" />
                </svg>
              </a>
            </div>
          {{ else }}
            <div class="monitor-site-status-icon" title="Not checked yet">
              <a href="{{ $linkUrl | safeURL }}" target="_blank" rel="noreferrer">
                <svg fill="var(--color-text-subdue)" xmlns="http://www.w3.org/2000/svg" viewBox="0 0 20 20">
                  <path fill-rule="evenodd" d="M10 18a8 8 0 1 0 0-16 8 8 0 0 0 0 16ZM7 9.25a.75.75 0 0 0 0 1.5h6a.75.75 0 0 0 0-1.5H7Z" clip-rule="evenodd" />
                </svg>
              </a>
            </div>
          {{ end }}

        </div>
      {{ end }}
    </ul>

    {{ if eq $displayedItems 0 }}
      <div class="flex items-center justify-center gap-10 padding-block-5">
        <p>All sites are online</p>
        <svg class="shrink-0" style="width: 1.7rem;" xmlns="http://www.w3.org/2000/svg" viewBox="0 0 24 24" fill="var(--color-positive)">
          <path fill-rule="evenodd" d="M2.25 12c0-5.385 4.365-9.75 9.75-9.75s9.75 4.365 9.75 9.75-4.365 9.75-9.75 9.75S2.25 17.385 2.25 12Zm13.36-1.814a.75.75 0 1 0-1.22-.872l-3.236 4.53L9.53 12.22a.75.75 0 0 0-1.06 1.06l2.25 2.25a.75.75 0 0 0 1.14-.094l3.75-5.25Z" clip-rule="evenodd" />
        </svg>
      </div>
    {{ end }}
Full YAML example (app-config + monitors + integrations)
This is just a full example of a YAML configuration file, which you can use as a starting point for your own configuration. You can copy and paste it into your own configuration file, and then modify it to suit your needs, but always make sure that you read the corresponding documentation sections for each feature or integration you want to use.
Warning
Be aware that if you define your monitors or your status pages via YAML, you cannot use the Web UI to modify them, you can only view them there!
micronaut.security.enabled: true
micronaut.security.token.generator.access-token.expiration: 86400 # 24 hours
admin-auth:
  username: YourSuperSecretUsername
  password: YourSuperSecretPassword
  api-key: ThisShouldBeVeryVerySecureToo
  mcp-api-key: ThisShouldBeVeryVerySecureToo
app-config:
  event-data-retention-days: 365
  latency-data-retention-days: 7
  log-event-handler: true
  language: en
  check-updates: true
  http-check-timeout-seconds: 30
  http-check-max-redirects: 10
---
smtp-config:
  host: 'your.smtp.server'
  port: 465
  transport-strategy: SMTP_TLS
  username: YourSMTPUsername
  password: YourSMTPPassword
---
integrations:
  pagerduty:
    - name: pd_global
      integration-key: YourOwnIntegrationKey
      global: true
      enabled: true
  slack:
    - name: slack_default
      webhook-url: 'https://hooks.slack.com/services/T00000000/B00000000/XXXXXXXXXXXXXXXX'
  discord:
    - name: discord
      webhook-url: https://discord.com/api/webhooks/XXXXXXX/YYYYYYYYY
  email:
    - name: email_implicitly_enabled
      from-address: noreply@kuvasz-uptime.dev
      to-address: your@email.address
  telegram:
    - name: telegram_disabled
      api-token: 'YourToken'
      chat-id: '-1232642423121'
      enabled: false
  webhook:
    - name: webhook_templated
      url: https://any-other-http.service/webhooks
      http-method: POST # optional, defaults to POST; PUT, PATCH and GET are also supported
      excluded-events:
        - PUSH_UP
        - HTTP_UP
        - SSL_WILL_EXPIRE
      request-headers:
        Accept: '*/*'
        Authorization: Bearer your-webhook-secret-token
        X-Custom-Header: "This can be a template as well: {{ ctx.type }}"
      payload-template: |
        {
          "monitorName": "{{ctx.monitorName}}",
          "type": "{{ctx.type}}"
        }
---
http-monitors:
  - name: "full configuration example"
    url: "https://akobor.me"
    sensitive-url: false
    uptime-check-interval: 30
    enabled: true
    ssl-check-enabled: false
    request-method: "POST"
    latency-history-enabled: true
    follow-redirects: true
    cross-origin-header-propagation: false
    force-no-cache: true
    ssl-expiry-threshold: 30
    failure-count-threshold: 2
    integrations:
      - "telegram:telegram_disabled"
      - "slack:slack_default"
    expected-status-codes:
      - 200
      - 201
      - 303
    expected-keyword: "akobor"
    expected-keyword-case-sensitive: true
    expected-keyword-negated: false
    response-time-threshold-millis: 500
    request-headers:
      Host: "example.com"
    expected-headers:
      Content-Type: "application/json"
    request-body: "{\"key\":\"value\"}"
  - name: "minimal configuration example"
    url: "https://kuvasz-uptime.dev"
    uptime-check-interval: 5
push-monitors:
  - name: "My Push Monitor"
    heartbeat-interval: 10
    grace-period: 2
    failure-count-threshold: 3
    client-secret: "d6d5a85c-82c0-4bea-9926-c3eed32de32b"
    enabled: true
    integrations: [ ]
  - name: "Another Push Monitor"
    heartbeat-interval: 86400
    grace-period: 3600
    client-secret: "7b2d5cb1-41bd-4067-9732-c79dbbf45286"
    enabled: false
    integrations:
      - "slack:slack_default"
icmp-monitors:
  - name: "My ICMP Monitor"
    host: "example.com"
    uptime-check-interval: 60
    packet-count: 3
    timeout-seconds: 5
    packet-loss-threshold: 100
    failure-count-threshold: 1
    enabled: true
    metrics-history-enabled: true
    integrations:
      - "slack:slack_default"
  - name: "Local router"
    host: "192.168.1.1"
    uptime-check-interval: 30
    enabled: true
tcp-monitors:
  - name: "My TCP Monitor"
    host: "example.com"
    port: 5432
    uptime-check-interval: 60
    timeout-ms: 5000
    latency-threshold-ms: 1000
    failure-count-threshold: 1
    enabled: true
    metrics-history-enabled: true
    integrations:
      - "slack:slack_default"
  - name: "SMTP server"
    host: "192.168.1.10"
    port: 25
    uptime-check-interval: 30
    enabled: true
dns-monitors:
  - name: "My DNS Monitor"
    host: "example.com"
    uptime-check-interval: 60
    resolver-host: "1.1.1.1"
    resolver-port: 53
    transport: "UDP"
    record-matchers:
      - record-type: "A"
        match-type: "EXACT"
        value: "93.184.216.34"
      - record-type: "TXT"
        match-type: "CONTAINS"
        value: "v=spf1"
    expected-response-code: "NOERROR"
    drift-detection-enabled: true
    drift-record-types:
      - "NS"
      - "MX"
    timeout-ms: 5000
    latency-threshold-ms: 1000
    failure-count-threshold: 1
    enabled: true
    metrics-history-enabled: true
    integrations:
      - "slack:slack_default"
  - name: "Decommissioned host must not resolve"
    host: "old.example.com"
    uptime-check-interval: 300
    expected-response-code: "NXDOMAIN"
    enabled: true
maintenance-windows:
  - name: "Nightly DB maintenance"
    description: "Recurring nightly database maintenance"
    enabled: true
    global: false
    show-on-status-pages: true
    cron: "0 2 * * *"
    duration: "PT1H"
    monitors:
      - "http:full configuration example"
      - "icmp:My ICMP Monitor"
      - "tcp:My TCP Monitor"
      - "dns:My DNS Monitor"
    integrations:
      - "slack:slack_default"
  - name: "Datacenter migration"
    description: "One-off, all monitors are paused during the migration"
    start: "2026-08-01T22:00:00Z"
    duration: "PT2H"
    global: true
---
default-status-page:
  public: true
  title: "Status - Kuvasz Uptime"
  custom-logo-url: "https://example.com/logo.png"
  custom-favicon-url: "https://example.com/favicon.png"
status-pages:
  - title: "Example Status Page"
    slug: "example-status"
    public: true
    custom-logo-url: "https://example.com/logo.png"
    custom-favicon-url: "https://example.com/favicon.png"
    monitors:
      - "http:full configuration example"
      - "http:minimal configuration example"
      - "push:My Push Monitor"
      - "icmp:My ICMP Monitor"
      - "tcp:My TCP Monitor"
      - "dns:My DNS Monitor"