Docker monitoring
Docker monitoring allows you to check whether a container is actually running and healthy - not just whether it still holds a port - by asking the Docker daemon itself about its state.
A TCP or HTTP check against a port a container happens to expose misses a lot: a crash-looping container, one that was OOM killed, a paused one, or one whose own healthcheck reports it unhealthy while its port is still open. And it says nothing at all about containers without a listening socket, like workers, cron jobs or sidecars. A Docker monitor covers all of them.
How does it work?
Kuvasz talks to the Docker Engine API of the Docker hosts you configured, and periodically inspects the container of each monitor. For each check it evaluates:
- The state of the container (
running,exited,paused,restarting, ...) - Its healthcheck, if the container defines one
- Why it stopped - the exit code, and whether it was OOM killed
- Optionally, its CPU and memory usage
The monitor is UP while the container is running and not reported unhealthy by its healthcheck (a container without a healthcheck, or one that is still starting, counts as healthy). Anything else marks it DOWN, and you are notified through your configured notification channels, with an error that tells you what actually happened:
| Container state | Status | Example error |
|---|---|---|
running, healthy or no healthcheck |
UP | |
running, but unhealthy |
DOWN | The container is running, but its healthcheck has failed 3 times in a row |
exited |
DOWN | The container exited (137) after it was OOM killed |
restarting |
DOWN | The container is restarting |
paused, created, removing, dead |
DOWN | The container is paused |
| the container doesn't exist | DOWN | There is no container called "my-app" on the Docker host "local" |
| the daemon cannot be reached | DOWN | The Docker host "local" cannot be reached: ... |
| the host is not configured anymore | DOWN | The Docker host "local" is not configured |
The image the container was created from is recorded with every uptime event as well, so the incident list and the monitor's details page tell you which version was running when something went wrong - handy when a container went down right after an update.
Restarts
A container whose restart policy brings it back after a crash can look perfectly healthy: if it's running again by the next check, the monitor stays UP, and the crash goes unnoticed. That's why every check also records how many times the restart policy has restarted the container (RestartCount), together with when the container was created.
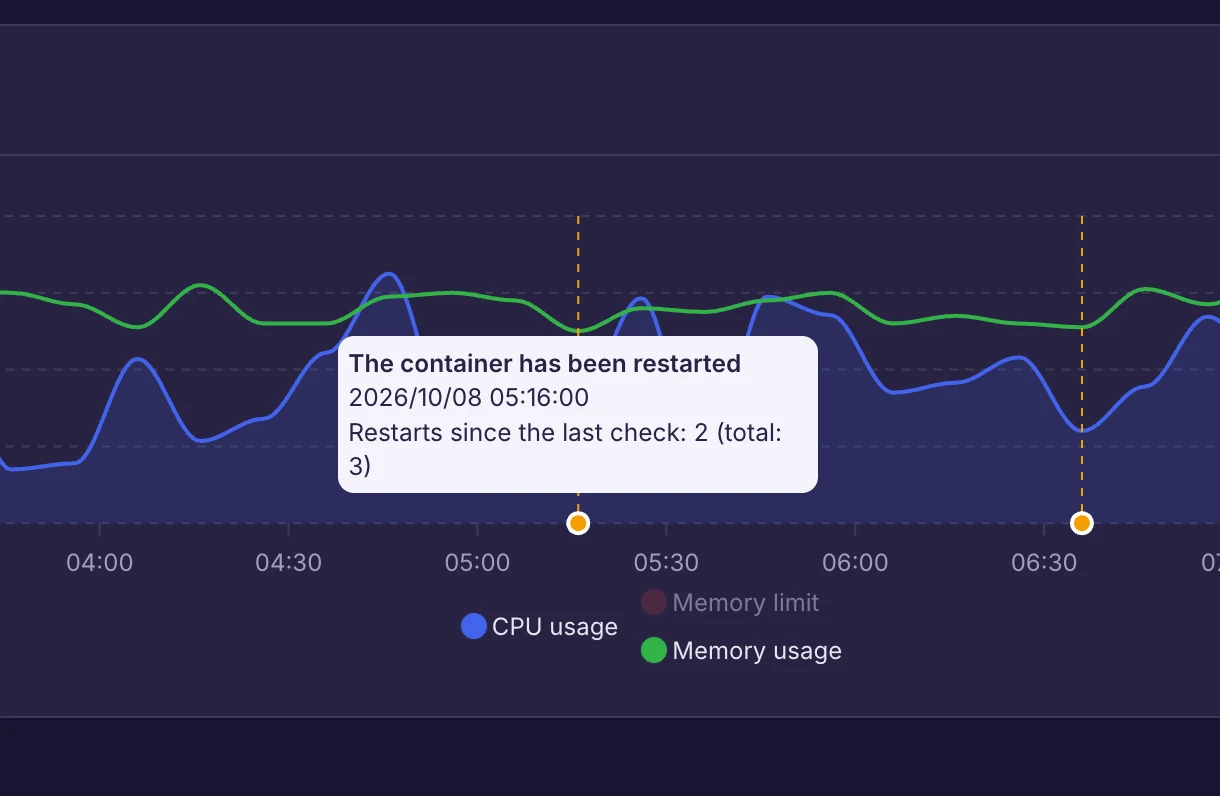
When restart alerts are enabled on a monitor, an increase of that count triggers a dedicated DOCKER_CONTAINER_RESTARTED notification, telling how many times the container was restarted since the previous check. A restart never marks the monitor DOWN, and it doesn't affect its uptime either. To keep the notifications meaningful:
- Only an UP check sends one. If a check catches the container while it's restarting (and so the monitor goes DOWN), the DOWN notification already tells you about it, so the restarts that happen while the monitor is DOWN don't trigger another one. The restarts that happened before the monitor went DOWN - e.g. while the failure count threshold wasn't reached yet - are reported by the next UP check.
- A manual restart (
docker restart) resets the count to zero, and a recreated container (e.g. afterdocker compose upwith a new image) starts from zero too. Neither of them is a restart of the restart policy, so they are recorded silently. If the restart policy restarts the container after a manual restart, but before the next check, those restarts are still reported, counted from zero. If the count ends up higher than the one before the manual restart, though, the reset can't be told apart from fewer restarts, so the notification reports fewer restarts than actually happened. - If a check can't inspect the container (e.g. the daemon is unreachable), the last known count is kept, so the restarts that happened meanwhile are still reported once the container can be inspected again.
- The checks are suspended during maintenance windows, so the restarts that happened during one are reported by the first UP check after it.
When metrics history is enabled, the checks that found the container restarted are also marked on the metrics chart of the monitor's details page, and the count can be exported as a metric too.
Docker hosts
The daemons Kuvasz talks to are called Docker hosts, and they are defined in your configuration file, not on the UI. A host can be the local daemon through its unix socket, or a remote one over TCP, optionally secured with TLS or mutual TLS. Each of them has a name, and a monitor refers to its host by that name.
Access to a Docker daemon is equivalent to root access on its host, so this is a deliberate choice: the credentials stay in your configuration file (or in your environment variables, or in your Kubernetes secrets), and they never end up in the database. Please read the Docker hosts section before setting one up, especially the part about the security considerations.
Resource usage
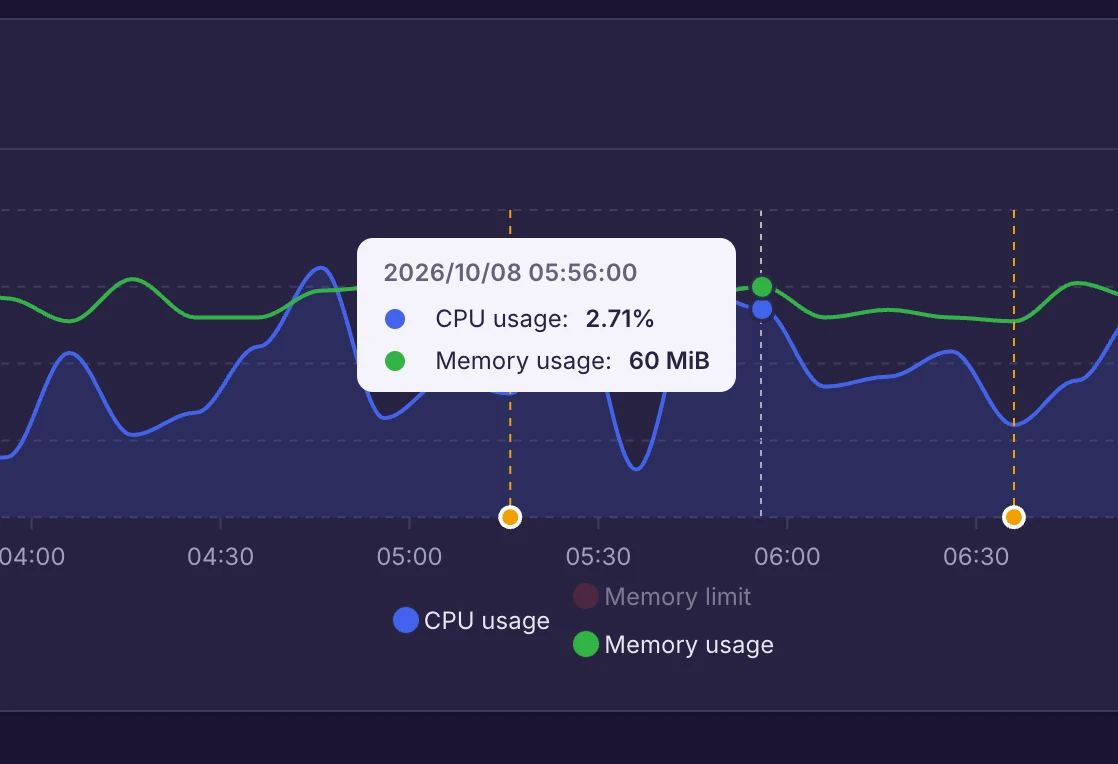
When metrics history is enabled on a monitor, every check also takes a CPU and memory sample of the container, in the same terms docker stats reports them. They are charted on the monitor's details page, and summarized as average, minimum and maximum values over the selected period.
Sampling is opt-in, because it isn't free: it costs an extra Docker API call on every check, and the daemon needs two reads of the counters to calculate the CPU usage, which comes out of the monitor's timeout.
About the latency
Docker checks measure latency too, but it is the round-trip to the Docker daemon, not anything about the container itself. That's why it isn't charted on the UI: it is only exported as an operational metric, which is useful for watching a remote daemon.
What can be configured?
- interval for uptime checks
- the Docker host, and the name (or the ID) of the container
- the timeout of the Docker API requests (1-30000 milliseconds)
- consecutive failure count threshold
- whether resource (CPU and memory) usage should be sampled and recorded
- whether you should be notified when the restart policy of the container restarts it
Compatibility
Docker Engine versions
Kuvasz doesn't pin a single Engine API version, since there is none that every supported daemon accepts: Engine 29.0-29.2 reject everything older than API 1.44, while Engine 24.0 and older don't know anything newer than 1.43. Instead, it negotiates the version with each host the way Docker's own client does it (through the /_ping endpoint), and uses the daemon's own version, between 1.40 and 1.44.
| Docker Engine | API version | Supported |
|---|---|---|
| 19.03 | 1.40 | ✅ The oldest supported version |
| 20.10 - 24.0 | 1.41 - 1.43 | ✅ The daemon's own version is used |
| 25.0 and newer (incl. 29.0-29.2) | 1.44 | ✅ |
| Older than 19.03 | < 1.40 | ❌ The daemon rejects the requests, and its own error message is shown on the monitor |
The negotiated version of each host is shown on the Settings page of the Web UI, next to the host.
Connections
| Connection | Supported | Note |
|---|---|---|
Unix socket (unix://) |
✅ | The local daemon, e.g. unix:///var/run/docker.sock |
TCP (tcp://, http://) |
✅ | Plaintext, only for trusted networks |
TLS (tcp://, https://) |
✅ | With your own CA, a client certificate, or both (mutual TLS) |
SSH (ssh://) |
❌ | |
Named pipe (npipe://) |
❌ | A local-only transport on Windows; reach a Windows daemon over TCP instead, like any remote one |
Operating systems
The operating system of the daemon and the one of the containers are two different things:
| Daemon | Containers | Uptime & health | Resource usage |
|---|---|---|---|
| Linux | Linux | ✅ | ✅ |
| Windows (WSL 2 backend) | Linux | ✅ | ✅ |
| Windows | Windows | ✅ | ❌ |
Both cgroup v1 and v2 hosts are supported for the resource usage, and the version is detected per container, so hybrid setups work too. The reported memory usage excludes the page cache, the same way docker stats does it.
Configuration
Please refer to the Docker hosts and the Managing Docker monitors sections of the documentation for more information on how to configure Docker monitoring.